Original course artwork
The illustrations
Twenty-five drawings carry the course from policy words to empirical evidence. Each visual begins with a memorable metaphor, develops its economic intuition, and then connects that intuition to an analytical expression.
Four lectures · one evidence chain
From communication to a defensible claim
A signal reaches an audience, leaves imperfect traces in beliefs, becomes unexpected policy news, and competes for attention. The illustrations turn that chain into objects students can see, remember, and analyse.
Read the picture first, then use the teaching story beneath it to translate the visual intuition into economic language and evidence.
The course · four linked mechanisms


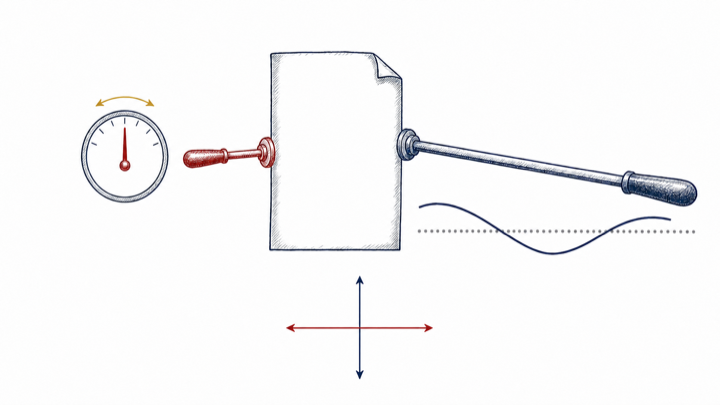

Lecture 1 · communication
Lecture 2 · measuring expectations
Lecture 3 · policy surprises
Lecture 4 · communication as data
How to read the drawings. White carries the full composition, navy carries the ordinary path, and crimson marks the object being selected, challenged, or diagnosed. Begin with the metaphor, follow the visual path, and then use the paragraph and equation to state the economic claim precisely.