The question
When people bring work to an AI system, their requests say something about the kinds of work that AI is used for. Anthropic publishes aggregate summaries of this activity in the Anthropic Economic Index. It classifies conversations on Claude.ai into activities and occupation categories and releases the shares by country. The project works only with those public summaries. It does not collect or read any conversation.
Turning the summaries into evidence about occupations in Europe or the UK takes several steps. The source uses US occupation categories, publication coverage differs from country to country, and a missing category may mean an unpublished observation rather than no activity. The project documents each of these choices and tests what they change.
What is published, and what is not
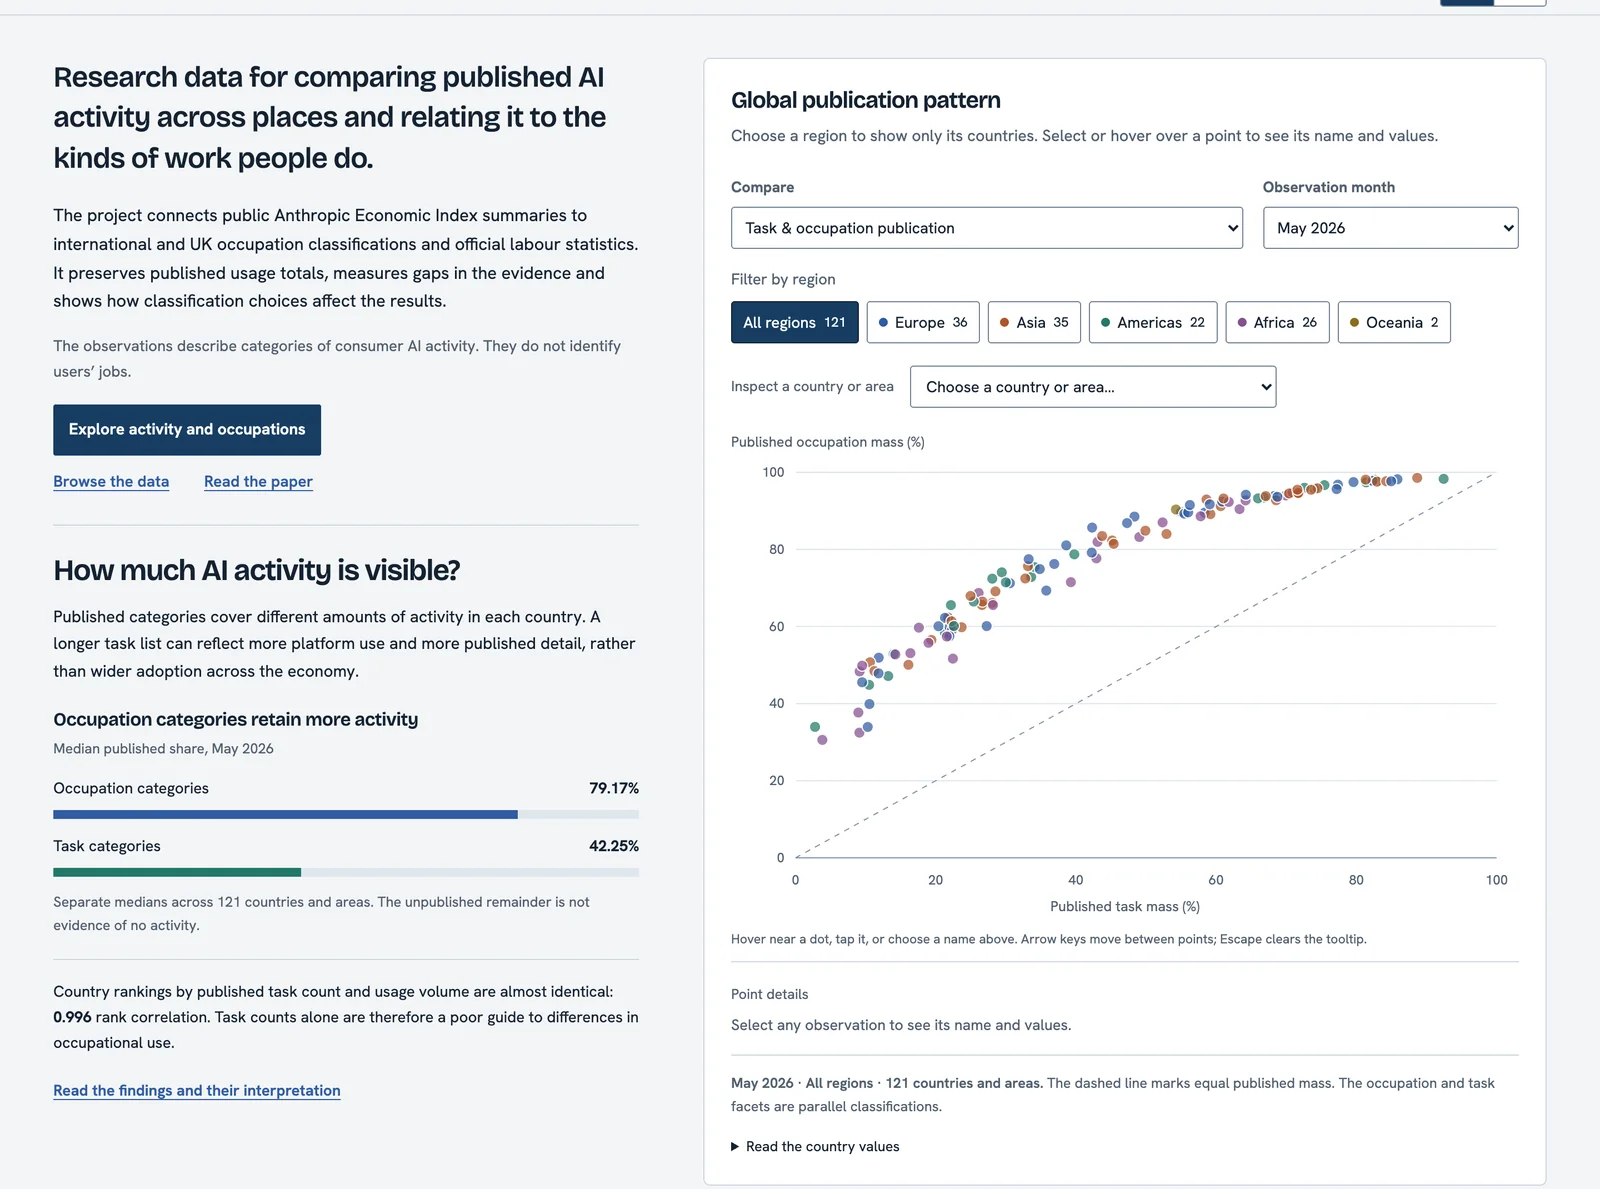
The main comparisons use the consumer Claude.ai observations for April and May 2026 from the release of 26 June 2026. Occupation observations are published for 121 countries and areas in May and 114 in April. Coverage changes the picture. For the median country the published occupation categories carry 79.17 per cent of consumer use, while the published detailed tasks carry only 42.25 per cent. A count of published tasks therefore describes the release, not how widely people use AI, and the project leads with direct occupation shares.
From US categories to European and UK ones
The source records occupations in the US O*NET system, while European and UK labour statistics use ESCO, ISCO and SOC. A crosswalk is a table of documented links between two classifications. The project follows the European Commission's ESCO–O*NET crosswalk to ESCO and ISCO, with a separate route to UK SOC through the coding index of the Office for National Statistics. Some links are exact and others are broader or narrower, so the method keeps the type of every link. A link describes how similar two job categories are. It does not record a worker or a conversation moving between them.
The allocation
Each published share of an O*NET occupation is divided across the destination occupations it links to, with fixed weights that sum to one. When a source has no usable link its share goes to an unmatched group instead of disappearing. Nothing is rescaled to 100 per cent, so the allocated shares and the unmatched share always add back to the published total. Employment never sets a weight.
Let \(p_k\) be the published share of source occupation \(k\) and \(R_k\) the set of destinations it reaches, with the unmatched group counted as a destination. In the baseline every allowed link gets an equal weight. Weights are set at the finest known destination and then summed to the level reported.
Because the links are uncertain, the method also reports how far each share could move under any other split of the same links. The lower bound counts only the sources that can reach no other destination, and the upper bound counts every source that can reach \(g\).
These ranges rest on the published values and the allowed links. They are not confidence intervals, and all groups cannot reach their upper bounds at once.
The released code computes all three quantities in one short function.
def allocate(published, weights):
    """Point allocation and sharp marginal mapping bounds conditional on source rows.

    Missing source rows are absent published mass, not imputed zero actual use.
    Lower/upper bounds allow any split among each source's reachable destinations.
    Their marginal extrema cannot generally be attained for all groups together.
    """
    possible = weights > 0
    forced = possible & (possible.sum(axis=1, keepdims=True) == 1)
    return published @ weights, published @ forced.astype(float), published @ possible.astype(float)
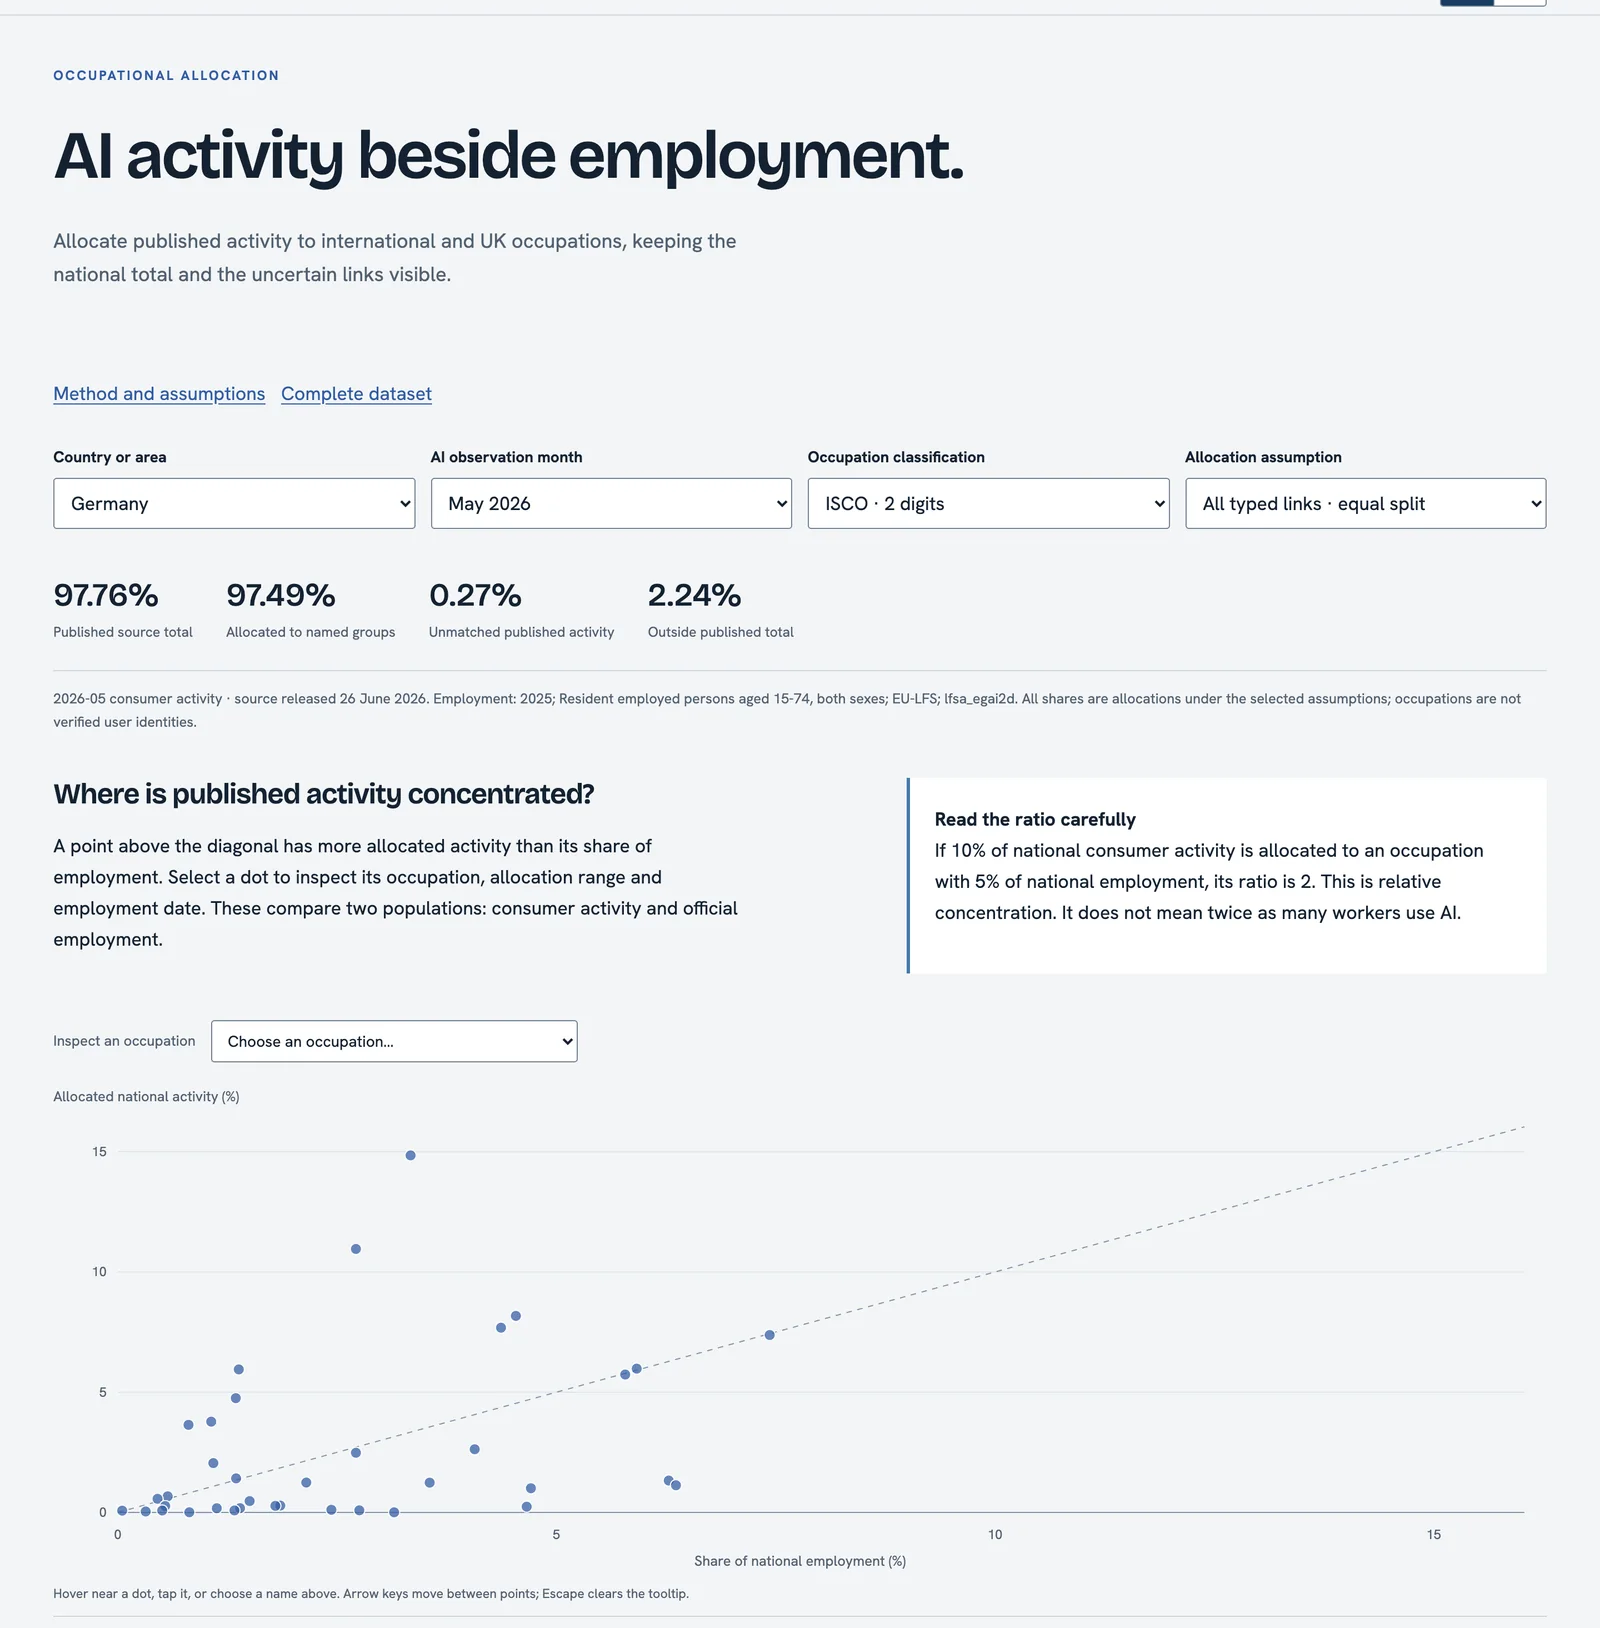
The allocation makes it possible to set an occupation group's share of activity beside its share of employment. Under the baseline mapping, ICT professionals in Germany receive 10.96 per cent of national consumer activity in May 2026 and hold 2.71 per cent of employment in 2025.
The ratio says that recorded activity is concentrated in this group relative to its jobs. It does not say that four times as many ICT workers use AI.
Thirty-five datasets
The data catalogue holds 35 datasets with previews and field definitions. They cover country and occupation evidence, publication coverage, the allocations with their ranges, employment context and validation, prepared panels of UK pay and employment, UK job adverts and European employment, April and May comparisons, and a reference of official ESCO labels for 3,010 occupations in 28 languages. A researcher can replace the allocation rule to test how sensitive a finding is, or start an employment or pay study from a prepared panel.
The code release includes an audit that rebuilds the allocations for Germany, France, the UK, the US and Bhutan from the public tables alone, without the production code.
python audit_public.py --export ./public-evidence --fetch --receipt ./audit.jsonWhat the evidence does not show
The observations are publication measures. They do not say who made a request, whether it was part of paid work or how many workers in an occupation use AI. The outcome panels contain no estimated effect of AI either. The historical outcomes come before the 2026 usage measure, and the one full month of job adverts after its release carries a notice about source quality. Representative surveys of workers and firms, longer outcome series and a credible research design would be needed to measure economic effects. The paper sets out these priorities in its research agenda.