Abstract
Public records of generative-AI activity offer evidence about use, but translating them into occupational statistics requires explicit treatment of publication coverage and classification. This paper studies country-level consumer observations from the Anthropic Economic Index for April and May 2026, covering 121 countries and areas in May. It distinguishes direct occupation shares from the breadth of published task categories and develops an auditable allocation to international and UK occupations. Across May geographies, published task counts correlate 0.996 with platform usage volume; median published usage is 42.25% in task categories and 79.17% in occupation categories. Allocating each source share with weights that sum to one preserves the published total, while recording unmatched activity and conditional mapping bounds. German ICT professionals receive an allocated 10.96% of country consumer activity against 2.71% of employment, illustrating a descriptive concentration comparison rather than worker adoption. Native US comparisons and theoretical exposure and PIAAC work-activity benchmarks provide partial construct evidence. An independent exposure reconstruction falls short of its declared numerical criterion. The contribution is a documented measurement framework and reusable data: 35 tables retain source values, allocation assumptions, publication states and statistical populations. Historical outcome joins support subsequent research, but the paper estimates neither causal labour-market effects nor predictive performance.
Keywords: generative AI; occupational measurement; platform data; publication coverage; classification crosswalks; employment
JEL classification: C43; C81; O33
1. Introduction
Research on artificial intelligence and work increasingly has access to records of what people ask AI systems to do. These observations complement assessments of what a model could do and surveys of who uses it. Yet a conversation category is not an occupational statistic without further assumptions. A person can ask for help with programming without being a programmer, and an employee can use AI for a task normally associated with another occupation. The platform, its users, the classifier and the released categories jointly determine what becomes visible.
International comparisons introduce another problem. The Anthropic Economic Index labels activities using the US O*NET system even when a conversation originates elsewhere. European labour statistics commonly use the International Standard Classification of Occupations (ISCO), while UK statistics use SOC 2020. These systems group work differently. A dictionary connecting their labels establishes possible correspondences; it does not specify how a published share should be divided between destination occupations. An average of several source shares, for example, need not preserve the source total.
This paper asks two linked questions. How much occupational information is represented in the public release, and how can that information be translated into other classifications without losing its original denominator? The first question concerns publication. The second concerns allocation and the assumptions required to compare activity shares with employment shares. Keeping them separate is essential: a complete crosswalk cannot recover unpublished activity, and complete publication cannot validate a semantic correspondence.
I construct a global evidence inventory and a source-normalized occupational allocation. The monthly source covers 114 countries and areas in April 2026 and 121 in May. Europe supplies the detailed classification case through ESCO, ISCO and UK SOC; the United States supplies a native SOC benchmark that does not require the international bridge. The common international allocation is also released for other countries. This geographical breadth is an inventory of available evidence, not a claim that the observations are representative or equally informative in every setting.
There are three contributions. First, the paper quantifies how released task breadth differs from platform volume and retained occupation mass. This gives an empirical reason to use direct occupation shares as the primary activity measure while treating task coverage as a publication diagnostic. Second, it constructs additive allocations with explicit unmatched categories, fixed alternative link sets and marginal mapping bounds. The resulting employment ratios answer a narrow question: how does allocated activity concentration compare with the occupational composition of employment? Third, it documents external comparisons and releases the ingredients needed to inspect the construction, replace assumptions and attach compatible outcomes.
The main findings make the measurement problem concrete. Country task counts rank almost identically to platform usage volume, and the typical geography retains considerably more usage in the occupation facet than in the task facet. Source-normalized weights preserve published totals, but plausible links still produce material occupational ranges. Independent benchmarks show partial agreement rather than equivalence. These findings support descriptive regional research; they do not identify users' jobs, workforce adoption, time saved or the effect of AI on employment.
The remainder proceeds from related research to data and definitions, allocation, results, validation and implications. Appendices A-E provide source construction, proofs and implementation rules, additional comparisons, exposure reconstruction and research-ready extensions.
2. Related literature
2.1 Observed activity and measured adoption
Handa et al. (2025) classify Claude conversations using O*NET tasks and occupations. Appel et al. (2025) extend the Economic Index to geographic and enterprise patterns, including a population-relative measure of use. Massenkoff et al. (2026) introduce more frequent sampling and revised classifications in the June release used here. These studies establish the value of observed interactions and also document why activity labels are platform-specific measurements. The present paper studies their released aggregates; it does not reclassify private conversations.
Other platforms offer complementary evidence. Chatterji et al. (2025) analyse consumer ChatGPT conversations, including work and non-work use. Tomlinson et al. (2025) combine Copilot interactions with work-activity and applicability measures. Differences in product, population and classifier make these valuable comparisons of measurement approaches, rather than interchangeable estimates of the same economic quantity. In contrast, Bick, Blandin and Deming (2024), using the February 2025 working-paper revision, measure adoption through US population surveys. A survey can ask about a respondent's occupation and use at work, whereas a public activity-share table ordinarily cannot.
2.2 Capability, exposure and occupational classification
Capability indices ask which tasks technology might assist. Eloundou et al. (2023) assess potential task-time reductions from language models. Felten, Raj and Seamans (2021) connect AI capabilities to occupational abilities, and their language-model extension (2023) focuses on a different capability set. Gmyrek et al. (2025) refine a global index of generative-AI occupational exposure; OECD (2026) maps its AI Capability Indicators to occupations. These constructions differ in technology, task universe and aggregation. None is, by definition, a measure of actual worker adoption.
Massenkoff and McCrory (2026) bring observed platform activity into an exposure measure, combining usage with capability, automation and task-time inputs. Their early US labour-market analysis is distinct from the publication and classification exercise here. I compare public descriptors with their exposure scores and attempt an input-based reconstruction, reporting its failure against the declared numerical criterion. Correlation with an exposure index can establish that two occupational rankings overlap; it cannot establish that they measure the same object.
The classification step is substantive. The European Commission's ESCO-O*NET crosswalk records typed semantic relations, while the ONS SOC 2020 coding index connects occupational labels to statistical codes. I use these relations to define admissible destinations and explicit allocation rules. Their existence does not identify the true distribution of conversations across local jobs. The contribution is a reproducible transformation with visible assumptions, rather than a new claim that occupational task content is globally identical.
2.3 Productivity, labour-market outcomes and the contribution here
Outcome studies require observations and designs beyond an activity classification. Noy and Zhang (2023) use a randomized writing-task experiment; Brynjolfsson, Li and Raymond (2025) study a workplace deployment in customer support. Their productivity evidence concerns specified tasks or workers. Hui, Reshef and Zhou (2024) study employment and earnings on an online labour market following generative-AI releases, while Humlum and Vestergaard (2025), in their March 2026 revision, connect Danish adoption surveys to administrative outcomes. Their populations, timing and identifying assumptions cannot be recovered from country conversation shares.
Fan and Nguyen (2026) use activity data to construct an indicative labour-cost-equivalent valuation. This provides a related application in which occupational and country denominators matter, but that valuation is not an observed wage change or a causal productivity estimate. Across these literatures, potential exposure, observed activity, adoption and outcomes remain distinct empirical objects.
This paper contributes to the measurement that precedes such applications. It preserves source shares, quantifies visible support, records the international allocation and exposes the sensitivity of occupational descriptions. Historical employment, pay and recruitment-advert joins are supplied as inputs for later research. The contribution is this documented transformation and measurement audit; no outcome effect is inferred from the new joins.
3. Data and empirical objects
3.1 Source, population and observation windows
The primary input is the Anthropic EconomicIndex dataset (2026), pinned to revision 2ea58ff75e4247d26810c37f10c179edc2466cac. The 26 June release provides consumer country observations for 1 April-1 May and 1 May-1 June 2026, with end dates exclusive. April supplies 114 country-months and May 121, for 235 monthly observations. The fixed task catalogue is O*NET 30.2. The selected consumer surface and the precise source facet, hierarchy and metric are retained in the data documentation.
These are activity observations in the selected source surface. They are not a census of AI use across products or a representative sample of workers. Geography refers to the source's location field, and an occupational label describes classified activity. The first-party API file has no country breakdown and is not distributed across countries by assumption. The June report also contains survey evidence; the public occupational aggregates used in this paper do not provide a person-level occupation-and-outcome linkage.
Earlier releases supply three weekly country task snapshots in August 2025, November 2025 and February 2026. Changes in sampling and classifiers prevent treating those snapshots and the monthly occupation observations as a uniform adoption series. Appendix A records all five windows and separates the 250-entry registry from the smaller observed samples. The May headline of 121 comprises countries and statistical areas with occupation rows, not every registry entry.
Official employment context comes from Eurostat, ILOSTAT, ONS/Nomis APS and the BLS National Employment Matrix. Each observation retains its source, period, population, classification and flags. The US Matrix counts jobs, including unincorporated self-employment, whereas the European examples use resident employed persons. Even when codes match, these populations are not automatically interchangeable.
3.2 Shares, publication and task breadth
Let denote geography, month and source occupation. For a released occupation percentage, define
where is the set of published occupation rows. The denominator of is the geography's consumer activity in that window. is the fraction represented in the published occupation categories. It is computed before crosswalks and is not rescaled to one. Activity outside the published total remains unallocated.
A published positive value, a published rounded zero and an absent row are separate states. An absent row contributes no published mass, but its actual use is unknown. The residual can combine unpublished or unclassified activity and rounding; the released aggregates do not identify their separate contributions. Source percentages have two decimal places, implying a row-level rounding half-width of at most 0.005 percentage points. Arithmetic rounding ranges are separate from sampling or classification uncertainty.
For occupation task set , catalogue coverage and task-share intensity are
Here is the published task fraction and the full catalogue stays in the denominator. A task may belong to several occupations. Consequently, adding task coverage or intensity across occupations does not recover national activity. Table 1 distinguishes these quantities from usage volume and the employment comparison developed below.
Table 1. Empirical quantities and denominators. Direct and allocated shares concern published consumer activity; catalogue statistics and donor means have different denominators.
| Quantity | Denominator | Interpretation |
|---|---|---|
| : global usage share | Global consumer usage in the source window | Relative geographic volume |
| : per-capita usage index | Geography's share of population aged 15-64 | Relative platform intensity |
| : direct occupation share | Geography's consumer usage | Published occupation-tagged mass |
| : task coverage | Tasks in a fixed occupation catalogue | Breadth of positive publication |
| : task-share intensity | Occupation catalogue task count | Released task-share fraction per task |
| Donor mean | Available semantic donors | Nonadditive taxonomy descriptor |
| Allocated | Original country consumer usage | Additive allocation conditional on candidate links |
| Concentration | Official national employment share | Allocated activity share divided by employment share |
4. Occupational allocation and employment comparison
4.1 A source-normalized crosswalk
Let be the share of source occupation assigned to destination under mapping scenario . The destination set includes an unmatched category. The construction imposes
Therefore the sum of allocated and unmatched activity equals . Normalization occurs within each source occupation; it never rescales the observed national total to 100%. This is the key difference from an average of linked occupations' shares. For illustration only, if a source has 6% of national activity and two possible destinations, equal allocation assigns 3% to each. Copying 6% to both would create 12%, while destination-wise averaging with other sources can either inflate or shrink the total.
The primary rule, equal_all, retains all typed links, deduplicates repeated source-destination pairs and splits a source equally among its distinct finest known ISCO destinations. Broader groups are obtained by summation. A link resolving only to three digits stays unresolved at four digits; it is not expanded into invented detailed children. The UK continues through an explicitly normalized ISCO-to-SOC 2020 bridge. Equal division is a transparent baseline assumption, not a probability estimated from conversations or workers.
Weights are fixed across countries and months. Employment and outcomes never choose them, preventing the numerator from mechanically inheriting the employment distribution used as its denominator. exact_only and exact_narrow restrict the permitted links before allocation. Excluded mass moves to unmatched rather than disappearing. A UK lexical_all alternative uses coding-index title counts normalized in the ISCO-to-SOC direction. Title frequencies are lexical information, not worker transition probabilities.
4.2 What uncertainty is measured
For each destination I report the minimum and maximum obtainable by reallocating published source shares among their permitted destinations. These marginal bounds are conditional on the link set and released source values. They do not include the publication residual, source-classifier error or uncertainty about which people use AI. They are not confidence intervals, and the upper endpoints for different destinations generally cannot all occur together. Appendix B gives the bounds and their attainability argument.
Conservation makes the arithmetic coherent but does not establish local semantic validity. Two countries can receive different allocations because their published source mixes differ under the same weights; that is not evidence that the weights fit each labour market equally well. The files retain original source shares and link-level weights so that regional researchers can replace the admissible set or allocation assumption and compare results.
4.3 Employment concentration
For compatible destination employment and the full official national total , define
A value of two means the group's allocated share of consumer activity is twice its share of employment. It does not mean that its workers are twice as likely to use AI: the activity numerator and employment denominator concern different populations, and users' occupations are not observed. Unmatched employment stays in the national total. Ratios are withheld for absent published donor support or missing or nonpositive employment; source flags and actual dates remain visible.
5. Results
5.1 Published breadth and platform volume
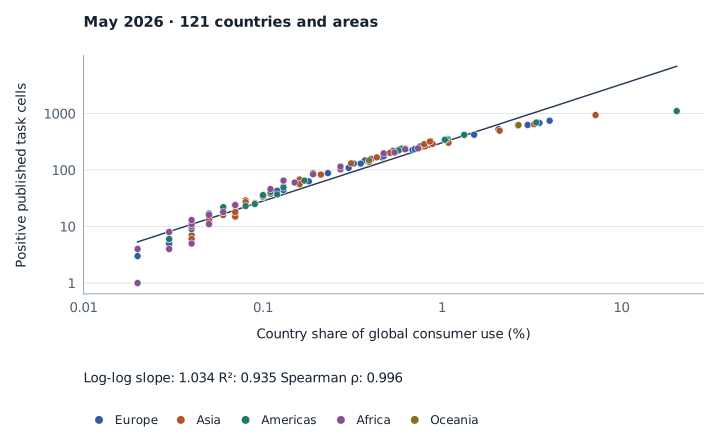
Across May's 121 geographies, the Spearman correlation between positive published task-cell counts and global consumer usage share is 0.9960. Natural-log OLS with an intercept gives a slope of 1.034 and (Table 2). The same relationship is strong in April. All observations in these regressions have positive, nonmissing usage shares and task counts.
Table 2. Natural-log OLS with an intercept. Source: Volume regression (download).
| Window | Geographies | Spearman | Log-log slope | HC3 SE | |
|---|---|---|---|---|---|
| April 2026 | 114 | 0.992 | 1.121 | 0.051 | 0.937 |
| May 2026 | 121 | 0.996 | 1.034 | 0.047 | 0.935 |
April 2026
- Geographies
- 114
- Spearman
- 0.992
- Log-log slope
- 1.121
- HC3 SE
- 0.051
- 0.937
May 2026
- Geographies
- 121
- Spearman
- 0.996
- Log-log slope
- 1.034
- HC3 SE
- 0.047
- 0.935
The near-unit elasticity means that geographies with more platform activity tend to have more task categories visible in the release. It does not identify whether disclosure, sampling, classification or actual task diversity produces the association. A country ranking by published task count would therefore confound task breadth with the scale of observed and released platform activity. HC3 standard errors describe the fitted relationship; the available countries are not a random sample supporting a general causal interpretation.
5.2 Occupation categories retain more published activity
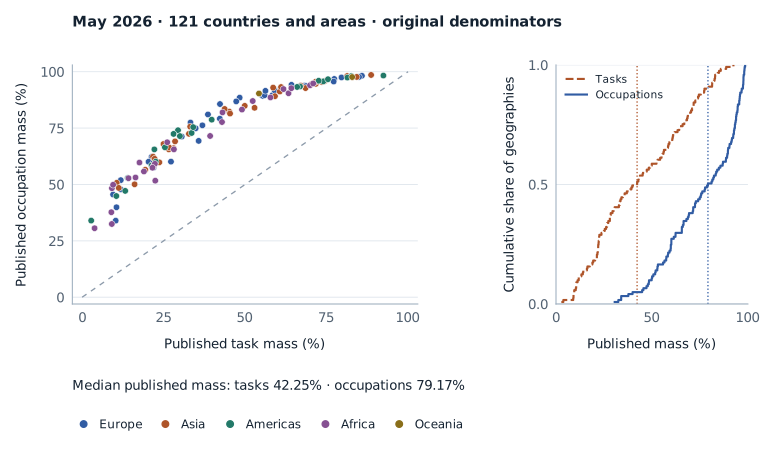
In the same 121 May geographies, median retained mass is 42.25% for task categories and 79.17% for occupation categories. These are two separate medians of country-level sums, each using its original consumer denominator. Their difference is not a share of workers or a time-saving estimate. To illustrate the arithmetic, a hypothetical 100 units of activity with 79 units represented in published occupation rows would leave 21 outside that published sum. The actual median is 79.17%, and individual countries differ substantially.
The UK retains 84.96% in tasks and 97.67% in occupations. It has 437 source occupations with a positive direct share, compared with 324 catalogue occupations containing at least one positive published task. An occupation category can therefore be visible even when the more detailed task facet does not reveal its constituent tasks. This supports choosing direct occupation shares for activity allocation, while preserving task measures for questions about published breadth.
5.3 Regional allocations preserve the observed total
The allocation reconciles for all 235 country-months and 2,852 combinations of country, month, classification, detail and scenario. The largest numerical discrepancy in the calculation is below percentage points. Table 3 illustrates why unmatched allocation and the publication residual must be reported separately. Germany's 97.76% published occupation mass becomes 97.49% assigned to ISCO2 groups and 0.27% unmatched. The remaining 2.24% is outside the published occupation total, not a share that the crosswalk is entitled to distribute.
Table 3. May 2026 accounting under all-link equal allocation. Allocated plus unmatched equals the original published occupation total. Extra decimal places display the accounting rather than greater precision in the source observations. Source: Allocation accounting checks.
| Geography and destination | Published (%) | Allocated (%) | Unmatched (%) | Outside published total (%) |
|---|---|---|---|---|
| Germany, ISCO2 | 97.7600 | 97.4900 | 0.2700 | 2.2400 |
| France, ISCO2 | 98.1900 | 97.8500 | 0.3400 | 1.8100 |
| UK, SOC 2020 four-digit | 97.6700 | 97.3055 | 0.3645 | 2.3300 |
Germany, ISCO2
- Published (%)
- 97.7600
- Allocated (%)
- 97.4900
- Unmatched (%)
- 0.2700
- Outside published total (%)
- 2.2400
France, ISCO2
- Published (%)
- 98.1900
- Allocated (%)
- 97.8500
- Unmatched (%)
- 0.3400
- Outside published total (%)
- 1.8100
UK, SOC 2020 four-digit
- Published (%)
- 97.6700
- Allocated (%)
- 97.3055
- Unmatched (%)
- 0.3645
- Outside published total (%)
- 2.3300
Figure 3 compares selected occupation groups in Germany and France using the same allocation and classification. Groups are selected by their mean allocated share across these two countries, not by a favourable employment ratio. This is a descriptive illustration with comparatively rich publication support, not an estimate of the European average.
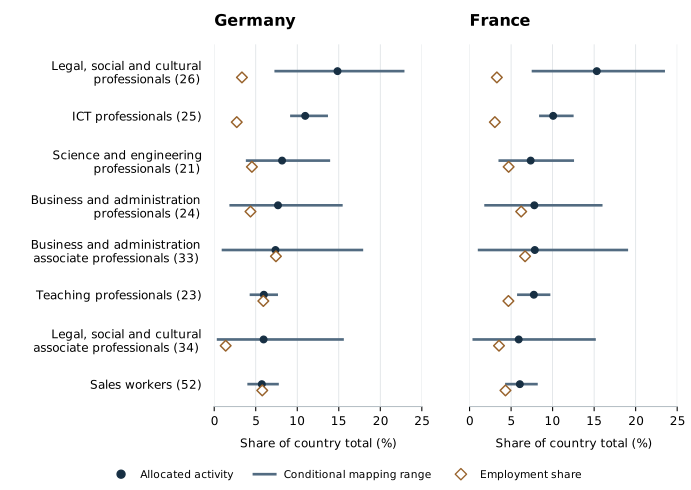
German ICT professionals receive 10.96% of allocated activity against 2.71% of employment, a ratio of 4.04 using unrounded inputs; the conditional activity range is 9.14-13.70%. France's corresponding values are 10.06%, 3.04% and 3.31, with a range of 8.37-12.53%. Teaching professionals provide a different comparison: the German ratio is 1.01 and the French ratio 1.65. Those differences concern classified consumer activity relative to employment; they do not show that AI has increased or reduced jobs in either group.
At least one ISCO2 employment ratio is available for 94 May countries and areas. That count does not certify comparable populations, vintages or classifications across all 94. Detailed UK output introduces another mapping stage and sometimes wide bounds. The interactive allocation view and downloadable tables therefore display the source population, date and support alongside each result.
6. Validation, sensitivity and interpretation
6.1 Native US comparison
Aggregating O*NET children to six-digit US SOC removes the international bridge. Direct occupation shares are summed at their original integer rounding precision; catalogue task measures are averaged within code. On 756 common occupations, May direct shares correlate 0.6284 with the March observed-exposure score of Massenkoff and McCrory (2026). The corresponding task-coverage and intensity correlations are lower (Table 4).
Table 4. Native SOC comparison. Source: US measure validation and US validation pairs.
| May US descriptor | Common SOC occupations | Spearman with March exposure |
|---|---|---|
| Published-task coverage | 756 | 0.5869 |
| Task-share intensity | 756 | 0.5814 |
| Direct occupation share | 756 | 0.6284 |
These are comparisons across periods and constructs, not a same-period classifier validation. The reference exposure incorporates work-related activity, global API use, capability, automation and task-time aggregation. Employment weights do not enter the rank correlations. The BLS Matrix contains 831 detailed line items; 772 exact matches cover 92.53% of the official 2025 total of 170,280,800 jobs. Unmatched aggregate codes remain unmatched rather than being split through an invented concordance.
An independent public-input exposure proxy reaches a correlation of 0.89465 and shares six occupations with the reference top ten. It falls short of the project's declared reconstruction criterion of at least 0.95 and eight common top-ten occupations. This is an operational reproducibility check, not a statistical test or proof that the publisher's measure is incorrect. Missing original time fractions and intermediate transformations prevent attributing the discrepancy to a single input. Appendix D reports the construction and the excluded time-weight experiment.
6.2 Mapping and construct comparisons
Appendix C reports mapping-route and capability comparisons for a fixed 11-geography diagnostic subset. The mapped quantities in those tables are nonadditive donor means, not the allocated shares used in Section 5. This distinction matters: those coefficients describe the sensitivity and construct alignment of the donor descriptors; they do not validate the new employment ratios.
For direct-share donor means, median within-country rank correlations with the all-typed route are 0.822 for exact links and 0.817 for exact-plus-narrow links on pairwise common ISCO4 support. Capability associations are positive for ILO, Eloundou and Felten comparators but negative for the retained OECD measure. The direction is reported as supplied rather than reversed to improve agreement. Neither a high rank correlation nor an exact semantic relation eliminates uncertainty about a specific local occupation.
PIAAC Cycle 2 supplies a separate check on work content. A fixed bridge links survey questions to seven activity domains. The comparison relates the survey share reporting an activity at least weekly to the corresponding catalogue-task share across occupations. The mean ISCO2 rank correlation is 0.733 for analysis and 0.290 for numerical processing across 16 survey geographies. Detailed French and Spanish comparisons include weak and negative coefficients. Respondent frequency is not time spent, and these comparisons concern catalogue work content rather than the adoption of AI.
6.3 Limits of inference
There are four distinct limits. Platform selection means that the observed users and their activity need not represent firms, workers or all AI products. Classification assigns an activity label without confirming the user's occupation or local task meaning. Publication reveals selected rounded aggregates, leaving a residual whose composition is unknown. Allocation then adds a transparent but unestimated rule connecting occupational systems. The accounting identity addresses the last step's arithmetic; it cannot resolve the other three.
The empirical uncertainty is therefore not summarized by one error bar. This paper separately reports publication support, conditional mapping ranges, alternative routes, employment flags and benchmark disagreement. Without source sampling information and independently labelled local observations, these diagnostics should not be advertised as a complete confidence assessment. In particular, a more detailed code or a larger retained share does not establish a more representative population.
7. Research implications and conclusion
7.1 What the data enable
The 35-table release makes the measurement choices inspectable. Researchers can reproduce a country publication total, compare the same source occupation across countries, replace an allocation rule, or attach a compatible employment series. Comparing the same occupation means comparing its share of classified activity under specified support and denominator rules; it does not directly compare AI's economic impact on its workers. Original source rows remain available beside allocations and donor diagnostics, so those objects need not be conflated in downstream analysis.
The outcome extensions attach the fixed 2026 usage vector to UK employment and nominal hourly pay in 2021-2025, UK new recruitment adverts in January 2017-July 2026, and European annual employment from 2020 onward. These are prepared joins, not estimated effects. Earlier outcomes predate the predictor; using them would describe retrospective associations. July is the only full UK advert month after the 26 June predictor release in this snapshot and carries a source-quality notice, leaving no clean forward-test month under the stated rule. Adverts are not successful hires, and multiple mapping scenarios do not create independent outcome observations.
The fixed-weight April-May comparison can describe changes between two released distributions while preserving support information. It cannot establish a longer diffusion trend. The multilingual reference supplies 84,278 available occupation-language pairs across 3,010 ESCO occupations and 28 languages. It helps construct evaluation samples and identify corresponding labels; it does not establish the accuracy of a platform classifier in those languages. Appendix E records these boundaries and the validation protocol.
7.2 Implications for regional measurement
Useful extensions of the Economic Index would separate publication status, classifier uncertainty and sample support at the released-cell level. Privacy-compatible count bands or documented reasons for absent cells could help researchers distinguish insufficient publication support from low measured activity. Stable observation windows and versioned classifiers would make temporal comparison more credible. Regional classification work would benefit from independently labelled task descriptions and documented allocations between statistical systems.
Worker and firm surveys linked, with appropriate consent and privacy protection, to measured use would address a different limitation: they could identify occupational users and connect activity to representative adoption and outcome measures. Independently measured task-time information would aid validation of time-weighted exposure. These proposals follow from the unresolved objects in the present analysis; they are not claims that the current data recover those objects.
7.3 Conclusion
Public AI interactions can be made more useful for occupational research by preserving what they measure and exposing what transformations assume. In this sample, published task breadth closely follows platform volume, occupation categories retain more activity than task categories, and source-normalized crosswalks support coherent regional share comparisons. Mapping ambiguity and benchmark disagreement remain material. The contribution is an additive, documented account of published activity and the inputs for further research, with evidence about use kept distinct from claims about adoption or economic effects.
Appendix A. Data and construction
A.1 Source selection, observation windows and geography
At source grain, the identifiers include release, surface, observation dates, geography, facet, hierarchy, metric and category. The direct occupation extraction selects the consumer soc_occupation facet, hierarchy level 0 and metric pct. Duplicate source keys are rejected. Source labels and displayed values are preserved before mapping. The frozen source commit and retrieval hashes identify the dataset bytes; they do not certify measurement validity.
Table A1. Archived country observation windows. Earlier task counts and later direct-occupation counts describe different facets and window lengths.
| Observation window | Source release | Published content used here |
|---|---|---|
| 4-11 August 2025 | 15 September 2025 | One-week task observations; 113 geographies |
| 13-20 November 2025 | 15 January 2026 | One-week task observations; 116 geographies |
| 5-12 February 2026 | 24 March 2026 | One-week task observations; 117 geographies |
| 1 April-1 May 2026 | 26 June 2026 | Monthly country and direct occupation observations; 114 geographies |
| 1 May-1 June 2026 | 26 June 2026 | Monthly country and direct occupation observations; 121 geographies |
The monthly end dates are exclusive. Earlier weekly dates retain the source convention. The historical task inventory contains 581 country-period observations rather than 581 countries. No missing months are interpolated.
The geography spine uses UNSD M49 countries and areas, with Kosovo and Taiwan added as explicit source geographies. Non-geographic labels such as NONE and not_classified are excluded. The May sample comprises 118 UN member states, the State of Palestine, Puerto Rico and Taiwan; these labels describe statistical coverage.
Table A2. Coverage universes in the frozen inventory. Employment availability alone does not imply compatible population, date or occupational detail.
| Count | Definition |
|---|---|
| 250 | Registry entries |
| 180 | Recognised geographies with any country row in the four pinned releases |
| 128 | Geographies with a positive task cell in at least one archived window |
| 121 | Geographies with May direct occupation rows |
| 114 | Geographies with April direct occupation rows |
| 182 | Registry entries with a selected official employment series |
| 119 | Historical task geographies with an employment series |
| 113 / 106 | May / April occupation geographies with an employment series |
A.2 Row grains, missingness and precision
Table A3. Core public table grains and keys. Exact column names and the remaining datasets are documented in the catalogue.
| Table | Grain | Principal identifiers |
|---|---|---|
| Country usage | Geography-month | geography, start date |
| Direct occupation source | Geography-month-source occupation | geography, start date, O*NET occupation |
| O*NET occupation panel | Geography-month-O*NET occupation | country,date_start,onet_code |
| ESCO occupation panel | Geography-month-route-ESCO occupation-ISCO4 link | country,date_start,mapping_route,esco_uri,isco4 |
| ISCO occupation panel | Geography-month-route-ISCO group | country,date_start,mapping_route,occupation_level,occupation_code |
| US native soc panel | Observation-window-native SOC occupation | date_start,occ_code |
The source occupation file contains published rows only. The O*NET panel expands to the fixed catalogue and retains publication-state fields. ESCO and ISCO panels contain donor-mean diagnostics; allocated usage is a separate table keyed by country, period, classification, level, route and destination code. The native US panel also retains earlier weekly task descriptors: its employment period is not its platform date_start.
An absent row remains missing in the raw share column. Zero enters only published-mass bookkeeping for a supported country-period; it is never a claim of zero underlying activity. Rounded zeros retain their source status. For a sum of numeric rows, percentage points is a conservative arithmetic half-width from source rounding. This does not describe disclosure, classification or sampling error. No occupation distribution is rescaled to remove the publication residual.
A.3 Historical task bridge and reporting support
Historical task text first follows a legacy-ID bridge into the current catalogue. Only unmatched source cells may use exact normalized current-task text as a fallback. The procedure recovers 1,839 source cells, with zero observed convergent collisions in the frozen audit. Strictly matched rows are not expanded using a union of every text candidate. Changed text under a retained ID and identical text attached to multiple occupation-specific tasks remain flagged.
Source-share floors of 0.01, 0.05 and 0.10 percentage points are supplementary sensitivity checks. They remove small positive cells while holding the catalogue denominator and mapping route fixed. They do not reconstruct the publisher's count threshold.
Reporting grades remain downloadable diagnostics of publication and employment support. A requires at least 200 positive task cells, 90% occupation mass, both monthly observations, employment from 2020 onward, at least two-digit detail and 80% matched employment. B uses 100 tasks and 70% mass with the remaining conditions unchanged. C has May occupation evidence but fails an A/B condition; D has no May detailed occupation facet. Counts are 29 A, 11 B, 81 C and 129 D across the registry.
These rules were adopted after inspection and are not preregistered, estimated reliability scores or sample-representativeness measures. In particular, task breadth depends on platform scale and need not be an appropriate restriction for an occupation-share study. The main global publication results and allocations therefore are not limited to grade A. The historical 11-geography subset is retained only for the additional diagnostic tables in Appendix C, with its support criteria and component values visible.
A.4 Country volume and the population-relative index
The released global usage share is a percentage of global consumer activity. Let denote working-age population (15-64) in the publisher's reference. The population-relative index is conceptually
The project retains the publisher's released index rather than reconstructing it from rounded country shares. It compares usage share with population share, not the proportion of residents using AI. Neither nor enters the source-normalized occupation weights. A change in national usage volume can coexist with unchanged within-country occupation shares; these are distinct margins of activity.
Appendix B. Allocation, employment and diagnostic formulas
B.1 Candidate links and aggregation
The typed ESCO-O*NET library contains 4,253 relations, of which 498 are exact. The exact, exact-plus-narrow and all-typed routes use their respective candidate sets. An 8,627-link untyped alternative is used for donor-mean sensitivity only. Link multiplicity is not employment weight. The all-link allocation deduplicates sources and distinct ISCO destinations before normalization, so several ESCO labels leading to one ISCO code do not automatically give it more mass.
For a source with eligible finest destinations, the primary weight is at each destination. If no eligible destination is available, its weight is one on unmatched. Coarse aggregation sums these fine weights. If a source link is known only at a coarser level, that branch remains unmatched when requesting unsupported finer detail. In the UK, the normalized ISCO-to-SOC bridge is composed with the normalized O*NET-to-ISCO bridge. The lexical alternative normalizes title counts within ISCO source; simply transposing forward SOC weights would not have this property.
B.2 Conservation and marginal bounds
For nonnegative source shares, the row-normalization rule implies
The outer sum includes unmatched. A product of two nonnegative row-normalized bridges is also row-normalized when unmatched paths are carried through as an absorbing category. Thus a second bridge need not destroy conservation, although it can increase semantic ambiguity. The public reconciliation table checks this identity for every combination rather than only the illustrative countries.
Let be a source's reachable destinations at the chosen reporting level, including unmatched where applicable. If splits may vary freely within that set, the marginal bounds for group are
For the lower endpoint, every ambiguous source reaching can be assigned to another permitted destination; only forced sources remain. For the upper endpoint, every source capable of reaching can be assigned there. These constructions attain the endpoints for that single group under the stated unrestricted source-level model. They need not obey an additional shared intermediate-bridge constraint, and upper bounds for several groups need not be jointly attainable. The bounds are therefore sharp for the declared marginal model, not for every possible stronger model of the crosswalk.
Unpublished activity is excluded. Adding its residual to an upper envelope would require additional assumptions about where that activity could belong and the effect of source rounding. The reported ranges are conditional mapping diagnostics rather than confidence intervals for true national occupation use.
B.3 Employment matching and conditional summaries
For ISCO sources, the pipeline selects the finest eligible detail while retaining the actual year, sex and age scope, survey population, ICLS definition and publication flags. Finer observations can be older than an available coarse series. No source is silently relabelled to a common population or year.
For an available mapped score and employment , a conditional weighted mean is
The matched-employment fraction is
Different routes may have different matched denominators. Weighting a donor mean does not convert it into a national conversation-share allocation.
The United Kingdom uses APS employment and an open ONS SOC 2020 coding-index route. Counts of coding-index job titles supply lexical weights; they are not observed transition probabilities between SOC and ISCO. Earnings sensitivities use Eurostat SES 2022 and UK ASHE only where compatible values are available. Combining earnings and employment from different source populations does not produce a measured wage bill.
The allocated concentration denominator remains the full official employment total, including unmatched occupations. Conditional employment-weighted task summaries use only their stated matched support and must report that denominator separately. The US population is the BLS National Employment Matrix, as defined in the BLS documentation. Its 2025 base year is observed employment; its 2035 projections are not used as outcomes.
B.4 Nonadditive donor means
The typed O*NET-ESCO library contains 4,253 relations, including 498 exact links. Routes retain exact, exact-plus-narrow and all-typed relations separately; an 8,627-link untyped alternative supplies a sensitivity route.
For route and ESCO occupation , with available donor set , the descriptor is
Here equals the source share when a row exists and zero published mass for an absent row within a supported geography-month. The donor set includes all linked O*NET catalogue occupations with a defined published-mass value, including donors with no published row. Donors outside the available catalogue are excluded. This convention measures published mass; actual use for an unpublished donor remains unknown.
The same donor-mean operation is applied to task descriptors. A missing donor set remains missing. ISCO4 values are equal means across represented ESCO occupations. ISCO1 and ISCO2 values are direct means over represented ISCO4 groups, avoiding a nested average that would assign implicit extra weight to small branches.
These diagnostic mapped values are semantic donor means and are labelled as such. They do not conserve source mass and cannot be interpreted as allocated national shares. Alternative routes describe mapping sensitivity rather than sampling uncertainty. The ESCO occupation panel and ISCO occupation panel files retain route, donor count and support fields.
These formulas are retained to reproduce the diagnostic comparisons below. They should not be substituted for the source-normalized activity shares in employment ratios. The UK source-share-floor diagnostic illustrates their sensitivity: conditional employment-weighted May task coverage is 6.0209% at baseline and 1.4994% after a 0.10 percentage-point floor, holding the ONS coding-index route and APS support fixed. This is sensitivity to a source-share rule, not changing adoption.
Appendix C. Additional comparisons
C.1 Diagnostic subset and mapping sensitivity
The 11-geography subset was selected using the practical reporting rules in Appendix A. It includes Belgium, France, Germany, Italy, the Netherlands, Poland, Portugal, Spain, Switzerland, Türkiye and the UK. It is called the European core in the released diagnostic files. It is not the sample defining the global results or the full allocation release. Table C1 shows its source and employment support.
Table C1. May 2026 publication support and selected employment context. Source: Geography support.
| European core | Positive tasks | Occupation mass (%) | Employment period | Detail | Matched employment (%) |
|---|---|---|---|---|---|
| Belgium | 226 | 93.83 | 2025 | 2 | 99.8 |
| France | 744 | 98.19 | 2025 | 2 | 97.9 |
| Germany | 626 | 97.76 | 2025 | 2 | 99.4 |
| Italy | 420 | 96.78 | 2025 | 2 | 99.5 |
| Netherlands | 353 | 95.64 | 2025 | 2 | 99.0 |
| Poland | 262 | 94.18 | 2025 | 2 | 98.8 |
| Portugal | 218 | 92.39 | 2025 | 2 | 99.7 |
| Spain | 528 | 97.46 | 2025 | 2 | 99.8 |
| Switzerland | 234 | 93.63 | 2025 | 2 | 95.6 |
| Türkiye | 290 | 94.61 | 2025 | 2 | 99.4 |
| United Kingdom | 680 | 97.67 | 2026-03 | 4 | 99.6 |
Belgium
- Positive tasks
- 226
- Occupation mass (%)
- 93.83
- Employment period
- 2025
- Detail
- 2
- Matched employment (%)
- 99.8
France
- Positive tasks
- 744
- Occupation mass (%)
- 98.19
- Employment period
- 2025
- Detail
- 2
- Matched employment (%)
- 97.9
Germany
- Positive tasks
- 626
- Occupation mass (%)
- 97.76
- Employment period
- 2025
- Detail
- 2
- Matched employment (%)
- 99.4
Italy
- Positive tasks
- 420
- Occupation mass (%)
- 96.78
- Employment period
- 2025
- Detail
- 2
- Matched employment (%)
- 99.5
Netherlands
- Positive tasks
- 353
- Occupation mass (%)
- 95.64
- Employment period
- 2025
- Detail
- 2
- Matched employment (%)
- 99.0
Poland
- Positive tasks
- 262
- Occupation mass (%)
- 94.18
- Employment period
- 2025
- Detail
- 2
- Matched employment (%)
- 98.8
Portugal
- Positive tasks
- 218
- Occupation mass (%)
- 92.39
- Employment period
- 2025
- Detail
- 2
- Matched employment (%)
- 99.7
Spain
- Positive tasks
- 528
- Occupation mass (%)
- 97.46
- Employment period
- 2025
- Detail
- 2
- Matched employment (%)
- 99.8
Switzerland
- Positive tasks
- 234
- Occupation mass (%)
- 93.63
- Employment period
- 2025
- Detail
- 2
- Matched employment (%)
- 95.6
Türkiye
- Positive tasks
- 290
- Occupation mass (%)
- 94.61
- Employment period
- 2025
- Detail
- 2
- Matched employment (%)
- 99.4
United Kingdom
- Positive tasks
- 680
- Occupation mass (%)
- 97.67
- Employment period
- 2026-03
- Detail
- 4
- Matched employment (%)
- 99.6
In Table C1, matched employment is the fraction of the official total attached to a diagnostic score; it is not the fraction of workers whose activities were validated. The UK date is an APS reporting window rather than a calendar year. Table C2 compares donor-mean alternatives with the all-typed route on pairwise common ISCO4 support. The number of destination groups differs between routes, so high correlations can coexist with excluded occupations.
Table C2. May 2026; pairwise common support. Source: Mapping correlation distribution (download).
| Descriptor | Alternative | Geographies | Median | P10 / P90 | Common ISCO4 |
|---|---|---|---|---|---|
| Occupation share | Exact | 11 | 0.822 | 0.802 / 0.842 | 262 |
| Occupation share | Exact + narrow | 11 | 0.817 | 0.804 / 0.832 | 280 |
| Occupation share | Untyped | 11 | 0.892 | 0.889 / 0.900 | 412 |
| Task coverage | Exact | 11 | 0.767 | 0.743 / 0.812 | 262 |
| Task coverage | Exact + narrow | 11 | 0.759 | 0.737 / 0.811 | 280 |
| Task coverage | Untyped | 11 | 0.893 | 0.858 / 0.916 | 412 |
Occupation share · Exact
- Geographies
- 11
- Median
- 0.822
- P10 / P90
- 0.802 / 0.842
- Common ISCO4
- 262
Occupation share · Exact + narrow
- Geographies
- 11
- Median
- 0.817
- P10 / P90
- 0.804 / 0.832
- Common ISCO4
- 280
Occupation share · Untyped
- Geographies
- 11
- Median
- 0.892
- P10 / P90
- 0.889 / 0.900
- Common ISCO4
- 412
Task coverage · Exact
- Geographies
- 11
- Median
- 0.767
- P10 / P90
- 0.743 / 0.812
- Common ISCO4
- 262
Task coverage · Exact + narrow
- Geographies
- 11
- Median
- 0.759
- P10 / P90
- 0.737 / 0.811
- Common ISCO4
- 280
Task coverage · Untyped
- Geographies
- 11
- Median
- 0.893
- P10 / P90
- 0.858 / 0.916
- Common ISCO4
- 412
C.2 Capability comparators
Table C3 compares all-typed donor means with ILO, OECD, Eloundou and Felten scores. Country counts refer to the fixed diagnostic subset; rank correlations compare occupations within country. The OECD input is the published reversed normalized exposure measure, with higher values denoting greater exposure. Its negative associations are retained. Definitions and sample composition may contribute to disagreement, but this analysis does not identify their separate roles.
Table C3. May 2026, European core, all-typed mapping. Source: Comparator distribution (download).
| Comparator | Descriptor | Geographies | Median | P10 / P90 | Common occupations |
|---|---|---|---|---|---|
| ILO | Occupation share | 11 | 0.630 | 0.617 / 0.654 | 406 |
| ILO | Task coverage | 11 | 0.580 | 0.527 / 0.605 | 406 |
| OECD | Occupation share | 11 | -0.136 | -0.180 / -0.120 | 411 |
| OECD | Task coverage | 11 | -0.106 | -0.197 / -0.051 | 411 |
| Eloundou GPT-4 beta | Occupation share | 11 | 0.666 | 0.642 / 0.705 | 412 |
| Eloundou GPT-4 beta | Task coverage | 11 | 0.608 | 0.559 / 0.655 | 412 |
| Felten language | Occupation share | 11 | 0.701 | 0.675 / 0.746 | 411 |
| Felten language | Task coverage | 11 | 0.634 | 0.568 / 0.691 | 411 |
ILO · Occupation share
- Geographies
- 11
- Median
- 0.630
- P10 / P90
- 0.617 / 0.654
- Common occupations
- 406
ILO · Task coverage
- Geographies
- 11
- Median
- 0.580
- P10 / P90
- 0.527 / 0.605
- Common occupations
- 406
OECD · Occupation share
- Geographies
- 11
- Median
- -0.136
- P10 / P90
- -0.180 / -0.120
- Common occupations
- 411
OECD · Task coverage
- Geographies
- 11
- Median
- -0.106
- P10 / P90
- -0.197 / -0.051
- Common occupations
- 411
Eloundou GPT-4 beta · Occupation share
- Geographies
- 11
- Median
- 0.666
- P10 / P90
- 0.642 / 0.705
- Common occupations
- 412
Eloundou GPT-4 beta · Task coverage
- Geographies
- 11
- Median
- 0.608
- P10 / P90
- 0.559 / 0.655
- Common occupations
- 412
Felten language · Occupation share
- Geographies
- 11
- Median
- 0.701
- P10 / P90
- 0.675 / 0.746
- Common occupations
- 411
Felten language · Task coverage
- Geographies
- 11
- Median
- 0.634
- P10 / P90
- 0.568 / 0.691
- Common occupations
- 411
C.3 Work-content checks using PIAAC
PIAAC provides independent survey evidence on the frequency of broad work activities. A frozen bridge relates survey items to seven O*NET activity domains. The primary specification compares, across occupations within a survey geography and domain, the survey share reporting an activity at least weekly with the corresponding share of catalogue tasks. All typed links are used at ISCO two-digit level.
Every finite coefficient is retained, including those flagged for weak alignment. Country means are unweighted means of coefficients rather than pooled person-level correlations. Each public activity cell requires at least 30 valid respondents, and each rank correlation must meet the protocol's common-occupation requirement. Survey weights enter activity shares; replicate-weight design intervals are not claimed for the rank summaries.
Table C4. ISCO2, at-least-weekly survey share versus catalogue task share. Source: PIAAC across occupation summary (download).
| Activity domain | Survey geographies | Mean | Median | Occupations per correlation |
|---|---|---|---|---|
| Analysis | 16 | 0.733 | 0.740 | 26-35 |
| Communication | 16 | 0.373 | 0.390 | 19-31 |
| Computer work | 16 | 0.479 | 0.470 | 19-31 |
| Documentation | 16 | 0.568 | 0.587 | 26-35 |
| Information acquisition | 16 | 0.472 | 0.464 | 18-31 |
| Measurement | 16 | 0.390 | 0.428 | 26-35 |
| Numerical processing | 16 | 0.290 | 0.283 | 26-35 |
Analysis
- Survey geographies
- 16
- Mean
- 0.733
- Median
- 0.740
- Occupations per correlation
- 26-35
Communication
- Survey geographies
- 16
- Mean
- 0.373
- Median
- 0.390
- Occupations per correlation
- 19-31
Computer work
- Survey geographies
- 16
- Mean
- 0.479
- Median
- 0.470
- Occupations per correlation
- 19-31
Documentation
- Survey geographies
- 16
- Mean
- 0.568
- Median
- 0.587
- Occupations per correlation
- 26-35
Information acquisition
- Survey geographies
- 16
- Mean
- 0.472
- Median
- 0.464
- Occupations per correlation
- 18-31
Measurement
- Survey geographies
- 16
- Mean
- 0.390
- Median
- 0.428
- Occupations per correlation
- 26-35
Numerical processing
- Survey geographies
- 16
- Mean
- 0.290
- Median
- 0.283
- Occupations per correlation
- 26-35
Table C5 reports France and Spain at four digits. The number of common occupations varies by domain, and several French coefficients are near zero or negative. These results make a single pooled claim of classification validity inappropriate. The released comparisons use weighted survey activity shares but do not claim replicate-weight design intervals for their rank summaries. PIAAC data are from the Programme for the International Assessment of Adult Competencies, Organisation for Economic Co-operation and Development, Paris.
Table C5. ISCO4, all-typed mapping, at-least-weekly survey share versus catalogue task share. Source: PIAAC detailed country results (download).
| Activity domain | France | France occupations | Spain | Spain occupations |
|---|---|---|---|---|
| Analysis | 0.630 | 33 | 0.500 | 32 |
| Communication | 0.410 | 27 | 0.275 | 14 |
| Computer work | 0.358 | 27 | 0.433 | 14 |
| Documentation | 0.500 | 33 | 0.502 | 32 |
| Information acquisition | -0.073 | 27 | 0.291 | 14 |
| Measurement | -0.044 | 33 | 0.361 | 32 |
| Numerical processing | -0.022 | 33 | 0.233 | 32 |
Analysis
- France
- 0.630
- France occupations
- 33
- Spain
- 0.500
- Spain occupations
- 32
Communication
- France
- 0.410
- France occupations
- 27
- Spain
- 0.275
- Spain occupations
- 14
Computer work
- France
- 0.358
- France occupations
- 27
- Spain
- 0.433
- Spain occupations
- 14
Documentation
- France
- 0.500
- France occupations
- 33
- Spain
- 0.502
- Spain occupations
- 32
Information acquisition
- France
- -0.073
- France occupations
- 27
- Spain
- 0.291
- Spain occupations
- 14
Measurement
- France
- -0.044
- France occupations
- 33
- Spain
- 0.361
- Spain occupations
- 32
Numerical processing
- France
- -0.022
- France occupations
- 33
- Spain
- 0.233
- Spain occupations
- 32
Appendix D. Exposure reconstruction and task-time uncertainty
D.1 Reference algebra and reconstruction criterion
The reference exposure method is described by Massenkoff and McCrory (2026), appendix pp. 2-4. The typeset equations define work usage as the sum of work-related consumer and first-party API counts. The capability rule includes the original Eloundou scores of 0.5 and 1, treating both as eligible, and excludes zero.
For task , let be work-related consumer counts, global API counts, consumer automation share and capability. The published construction begins with
and, when ,
The gated task value is
with when , without evaluating the zero denominator. For occupation-specific task-time weights , exposure is
Both sums range over the occupation's full task set. Tasks that fail either gate contribute zero to the numerator but remain in the time-weight denominator; weights are not renormalized over eligible tasks.
The frozen independent proxy reaches Spearman 0.89465 on 756 occupations with 6 common top-ten occupations. The declared numerical criterion requires correlation at least 0.95 and at least 8 common top-ten occupations, so the proxy does not meet that criterion. Equal aggregation of already-published task scores reaches 0.87154 but is a downstream diagnostic, since those inputs embed publisher outcomes.
Original task-time fractions, work-share imputation, similar-task grouping, employment allocation and uncensored intermediates are not all available. A perfect reconstruction is therefore not asserted. The numerical criterion is an internal reproducibility target; it was not a public preregistration or a hypothesis test. The failed reconstruction does not invalidate the direct-share accounting, which uses a different observed input and estimand.
D.2 Excluded time-weight experiment and prospective protocol
A frozen local-model experiment generated implausible task-hour values: one task received two quadrillion weekly hours and 12 occupation totals exceeded 168 hours. Structural validity, exact identifiers and normalized shares cannot make those quantities credible. The weights and their exposure correlations remain in the audit record but are excluded from substantive findings. They are not clipped, selectively regenerated or chosen according to agreement with the target.
The prospective replacement protocol specifies three blinded independent draws, a 40-hour analytical allocation that includes uncovered activity, exact task identifiers, finite nonnegative entries, sum constraints and whole-draw rejection rules. A mean would be defined only for occupations with three valid draws, with missingness and between-draw variation reported.
Before a confirmatory run, the endpoint and settings, independent time-use evidence, validation sample and success criteria should be frozen and publicly registered. PIAAC frequency responses and O*NET importance ratings cannot substitute for observed time allocations. The protocol is a design for future validation, not an executed study.
Appendix E. Research extensions, data access and reproducibility
E.1 Outcome joins and their timing
The UK annual panel contains all 412 official SOC2020 unit groups, five outcome years (2021-2025), two AI months and four mapping scenarios: 16,480 rows. The monthly advert panel contains the same 412 groups, 115 months (January 2017-July 2026), two AI months and four scenarios: 379,040 rows. Each repeated outcome is the same observation under a different predictor specification, not an independent replicate. Total and unknown-occupation rows remain in the upstream source files; the linked panels contain named occupations. APS calendar-year employment and ASHE April hourly pay have different populations and reference periods; nominal pay excludes overtime.
The ONS/Textkernel source measures new adverts, not hires or vacancy stocks. Original suppression codes, source break flags and period-wide quality warnings are retained. A strict forward-test indicator requires an entire outcome month after the 26 June 2026 predictor publication, numeric outcome, and no retained cell or period warning. No row passes in this snapshot: July is the only full post-release month, and has a quality notice. No regression or forecast performance is estimated. Older annual outcomes and earlier advert months are retrospective associations if analysed against the fixed 2026 activity vector.
The European panel joins country and ISCO2 codes to annual Eurostat employment from 2020 onward, preserving provider population, date and break flags. The 17,544 rows contain two usage-month versions of the same outcomes. Historical outcomes predate the activity measurement. Neither join identifies worker adoption or causal labour effects.
E.2 Monthly comparisons and multilingual reference
The monthly comparison retains the same weights, ISCO2 groups and 114 common countries across April and May. It contains 5,016 rows including unmatched groups. Differences use original country denominators and published donor status. They are descriptions under fixed classifications, not a harmonized adoption trend; the earlier weekly releases are not appended.
The multilingual reference contains 84,278 available occupation-language pairs: 3,010 ESCO v1.1.2 occupation URIs across 28 languages. It is not a complete Cartesian grid. Preferred labels and available descriptions come from cached official ESCO responses; a shared URI and ISCO parent connect language versions. It supports label-retrieval evaluation and sample construction, not direct validation of platform conversations or local worker identities. The accompanying evaluation protocol specifies held-out examples and reporting; no model scores have been claimed.
The language reference comes from the European Commission ESCO classification. Its shared occupation URI joins labels across languages; agreement on a URI is not proof that a classifier understands local descriptions equally well. A confirmatory assessment would need independently labelled held-out examples, local reviewers, stated language and occupation sampling, a frozen evaluation procedure and per-language error reporting. The published protocol and scoring code supply a starting point, not completed accuracy results.
E.3 Files, verification and access
The data catalogue contains 35 curated tables with grains, keys, units, schemas and complete downloads. Publication diagnostics begin with facet comparison, volume regression and geography support. Allocation work begins with allocated occupation usage, allocation weights and reconciliation. The UK and European outcome panels retain source periods, flags and provider populations. These files allow a researcher to trace a figure to inputs or make a documented alternative construction.
The build verifies unique keys, finite values, admissible ranges, publication states, source-normalized weights, accounting identities and public-file hashes. An independent audit reconstructs allocations from the public source shares and weights. Such checks verify arithmetic and file consistency; they do not establish classifier accuracy or causal identification. Numerical results in this paper are taken from the frozen downloadable outputs, with table-specific links supplied throughout.
Component-specific attribution and redistribution terms apply. Restricted crosswalk and comparator vectors and respondent-level PIAAC records are excluded from the public package. Source manifests record URLs, retrieval dates and hashes; the released code and protocols document the transformations. The institutional affiliations of source producers do not imply endorsement of the transformations or conclusions.
References
Anthropic (2026). EconomicIndex. Dataset, revision 2ea58ff75e4247d26810c37f10c179edc2466cac; release 26 June 2026.
Appel, Ruth, Peter McCrory, Alex Tamkin, Miles McCain, Tyler Neylon, and Michael Stern (2025). Anthropic Economic Index report: Uneven geographic and enterprise AI adoption. arXiv preprint 2511.15080.
Bick, Alexander, Adam Blandin, and David J. Deming (2024). The Rapid Adoption of Generative AI. NBER Working Paper 32966; February 2025 revision used here.
Brynjolfsson, Erik, Danielle Li, and Lindsey Raymond (2025). Generative AI at Work. Quarterly Journal of Economics, 140(2), 889-942.
Chatterji, Aaron, Thomas Cunningham, David J. Deming, Zoe Hitzig, Christopher Ong, Carl Yan Shan, and Kevin Wadman (2025). How People Use ChatGPT. NBER Working Paper 34255.
Eloundou, Tyna, Sam Manning, Pamela Mishkin, and Daniel Rock (2023). GPTs are GPTs: An Early Look at the Labor Market Impact Potential of Large Language Models. arXiv preprint 2303.10130.
European Commission (n.d.). Crosswalk between ESCO and O*NET. Official crosswalk and technical documentation. Accessed 11 September 2026.
European Commission (n.d.). ESCO classification. Official occupation labels and descriptions; version 1.1.2 used here. Accessed 11 September 2026.
Eurostat (n.d.). Database: observation status flags. Official flag definitions and links to metadata. Accessed 11 September 2026.
Eurostat (n.d.). Employment by sex, age and occupation: EU Labour Force Survey annual data. Datasets lfsa_egai2d and lfsa_egais; source periods and flags retained. Accessed 11 September 2026.
Eurostat (n.d.). Structure of Earnings Survey. 2022 survey used for earnings sensitivities. Accessed 11 September 2026.
Fan, Rachel Yuting, and Ha Minh Nguyen (2026). Aggregate Gains from AI and Their Distribution: Global Evidence from Usage Data. IMF Working Paper 2026/147.
Felten, Ed, Manav Raj, and Robert Seamans (2023). How will Language Modelers like ChatGPT Affect Occupations and Industries?. arXiv preprint 2303.01157.
Felten, Edward, Manav Raj, and Robert Seamans (2021). Occupational, industry, and geographic exposure to artificial intelligence: A novel dataset and its potential uses. Strategic Management Journal, 42(12), 2195-2217.
Gmyrek, Paweł, Janine Berg, Karol Kamiński, Filip Konopczyński, Agnieszka Ładna, Balint Nafradi, Konrad Rosłaniec, and Marek Troszyński (2025). Generative AI and Jobs: A Refined Global Index of Occupational Exposure. ILO Working Paper 140. Geneva: International Labour Organization.
Handa, Kunal, Alex Tamkin, Miles McCain, Saffron Huang, Esin Durmus, Sarah Heck, Jared Mueller, Jerry Hong, Stuart Ritchie, Tim Belonax, Kevin K. Troy, Dario Amodei, Jared Kaplan, Jack Clark, and Deep Ganguli (2025). Which Economic Tasks are Performed with AI? Evidence from Millions of Claude Conversations. arXiv preprint 2503.04761.
Hui, Xiang, Oren Reshef, and Luofeng Zhou (2024). The Short-Term Effects of Generative Artificial Intelligence on Employment: Evidence from an Online Labor Market. Organization Science, 35(6), 1977-1989.
Humlum, Anders, and Emilie Vestergaard (2025). Still Waters, Rapid Currents: Early Labor Market Transformation under Generative AI. NBER Working Paper 33777; revised March 2026.
International Labour Organization (n.d.). ILOSTAT bulk download facility. Annual employment by sex and occupation; source-specific populations and classifications retained. Accessed 11 September 2026.
Massenkoff, Maxim, and Peter McCrory (2026). Labor market impacts of AI: A new measure and early evidence. Anthropic research report, 5 March; accompanying appendix, pp. 2-4, supplies the exposure algebra.
Massenkoff, Maxim, Eva Lyubich, Szymon Sacher, Zoe Hitzig, Shaoyi Zhang, Ryan Heller, and Peter McCrory (2026). Anthropic Economic Index report: Cadences. Anthropic research report, 26 June.
Noy, Shakked, and Whitney Zhang (2023). Experimental evidence on the productivity effects of generative artificial intelligence. Science, 381(6654), 187-192.
O*NET Resource Center (2026). O*NET Database 30.2. February 2026 release, available in the database archive.
OECD (2026). The OECD AI exposure measure: Mapping the OECD AI Capability Indicators to occupations. OECD Artificial Intelligence Papers, No. 59. Paris: OECD Publishing.
OECD (n.d.). Survey of Adult Skills (PIAAC): 2nd Cycle Database. Public-use data and codebooks. Accessed 11 September 2026.
Office for National Statistics (2026). Labour demand volumes by Standard Occupation Classification (SOC 2020), UK. ONS/Textkernel new online adverts, January 2017-July 2026; release 21 August 2026.
Office for National Statistics (n.d.). Annual Survey of Hours and Earnings: Occupation (4 digit SOC), Table 14. Annual paid hours and earnings for UK employees. Accessed 11 September 2026.
Office for National Statistics (n.d.). SOC2020 Volume 2: Coding rules and conventions. Official coding index and ISCO-08 links. Accessed 11 September 2026.
Office for National Statistics, Nomis (n.d.). Annual Population Survey. Residence-based occupation employment and source-quality information. Accessed 11 September 2026.
Tomlinson, Kiran, Sonia Jaffe, Will Wang, Scott Counts, and Siddharth Suri (2025). Working with AI: Measuring the Applicability of Generative AI to Occupations. arXiv preprint 2507.07935.
United Nations Statistics Division (n.d.). Standard country or area codes for statistical use (M49). Statistical geography registry. Accessed 11 September 2026.
US Bureau of Labor Statistics (2026). Table 1.2: Occupational projections, 2025-35, and worker characteristics, 2025. National Employment Matrix; 2025 base-year employment used here.
US Bureau of Labor Statistics (n.d.). Employment Projections: Definitions. Employment Matrix population and employment definitions. Accessed 11 September 2026.