Where a forecast stops seeing
Football gives forecasters a steady supply of clean tests. Seasons end, tables are final and every match has one result, so a model's claims can be checked against what happened. The two studies here use that property to ask where a model stops being informative. The first looks at a small group inside each league that a model trained on the whole league may read badly. The second sets a ladder of models against the betting market before a major tournament.
Promoted clubs: dominant below, drowning above
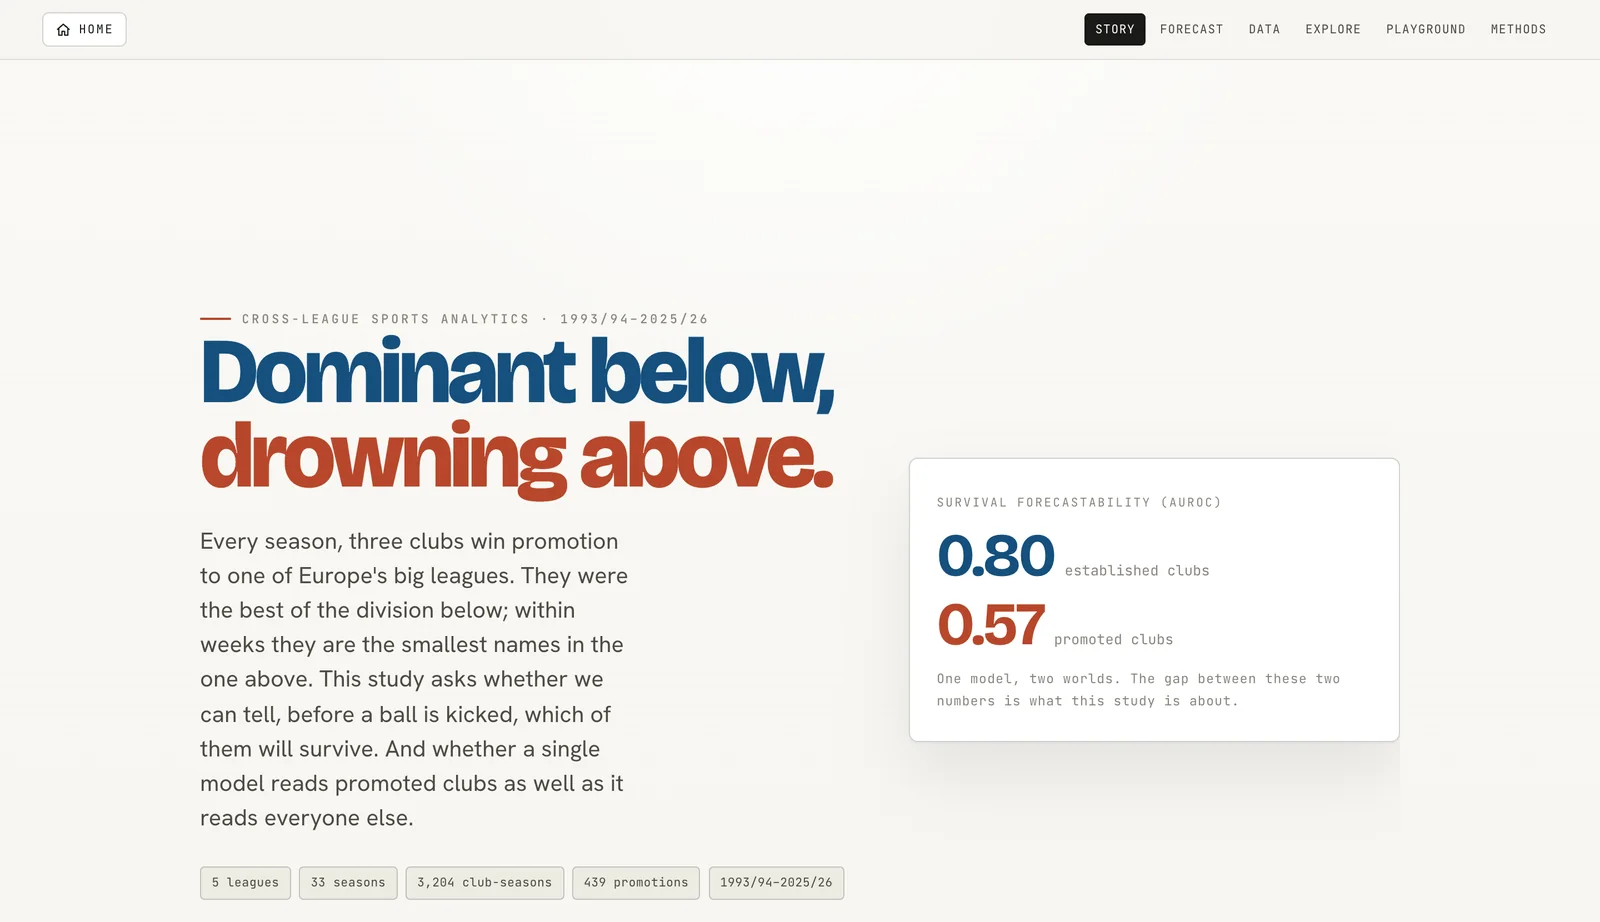
Each season a handful of clubs win promotion to Europe's big leagues. They were the best of the division below, and within weeks they are among the smallest names in the one above. The study covers England, Spain, Germany, Italy and France from 1993/94 to 2025/26, with 3,204 club-seasons and 439 promotions. In that period 67 per cent of promoted clubs stayed up in their first season, against 88 per cent of established clubs. England was the hardest league for newcomers, where 53 per cent survived.
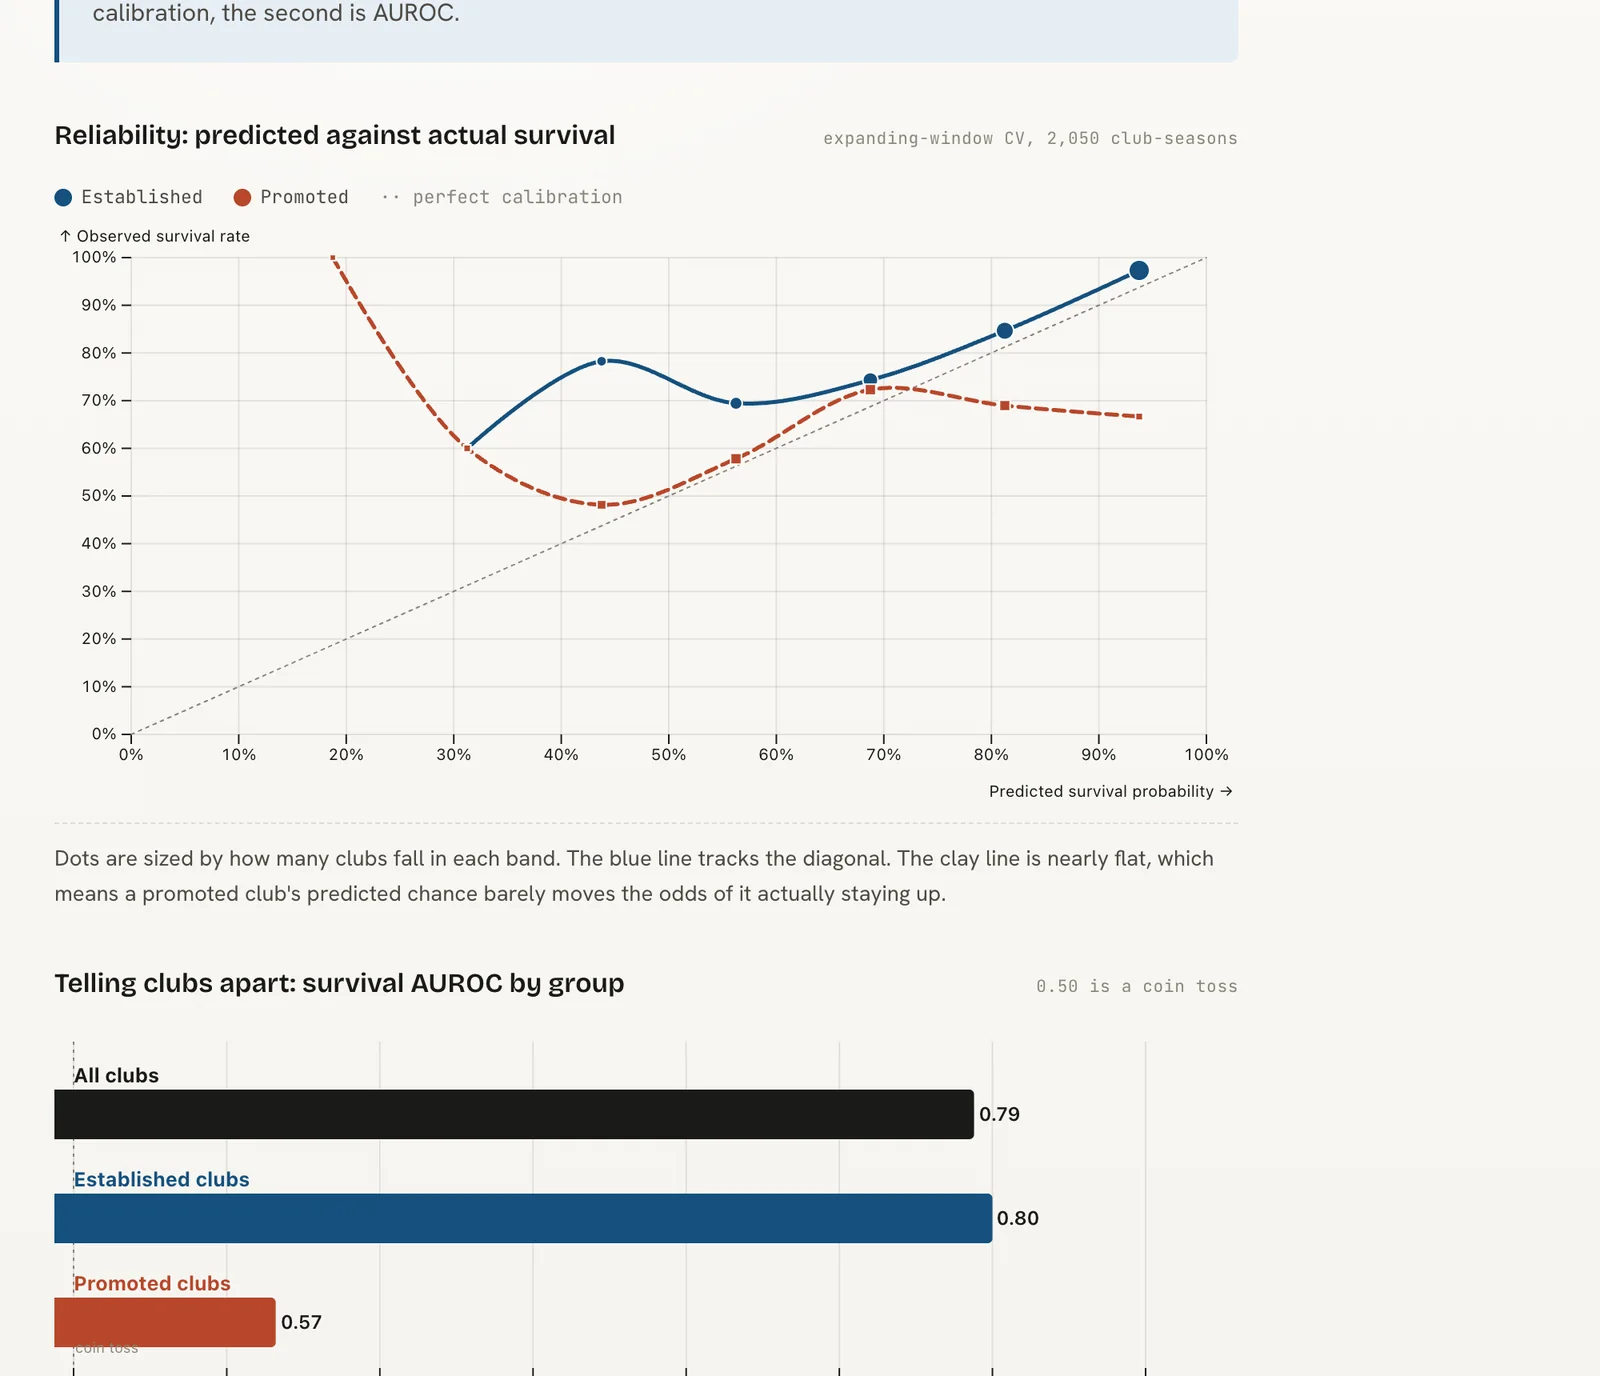
The models train on past seasons and forecast the next one, then the window rolls forward, so no forecast ever sees the season it predicts. Every score is reported separately for promoted and established clubs, and a second test trains on four leagues and predicts the fifth. The main score is the AUROC, the chance that the model ranks a club that stayed up above a club that went down, for a pair drawn at random.
A value of 1 ranks every such pair correctly, and 0.5 is a coin toss.
The same model that ranks established clubs well can barely rank promoted ones. Its survival forecasts reach 0.80 for established clubs and 0.57 for promoted clubs. The pattern holds in every league when that league is left out of training. The reason is the strength rating. Survival in a league depends mostly on a club's strength against the rest of the division, and promoted clubs are bunched at the bottom of that scale, with nearly nine in ten below the middle of their new league. The feature that separates everyone else has little room to separate them.
World Cup 2026: a ladder of models
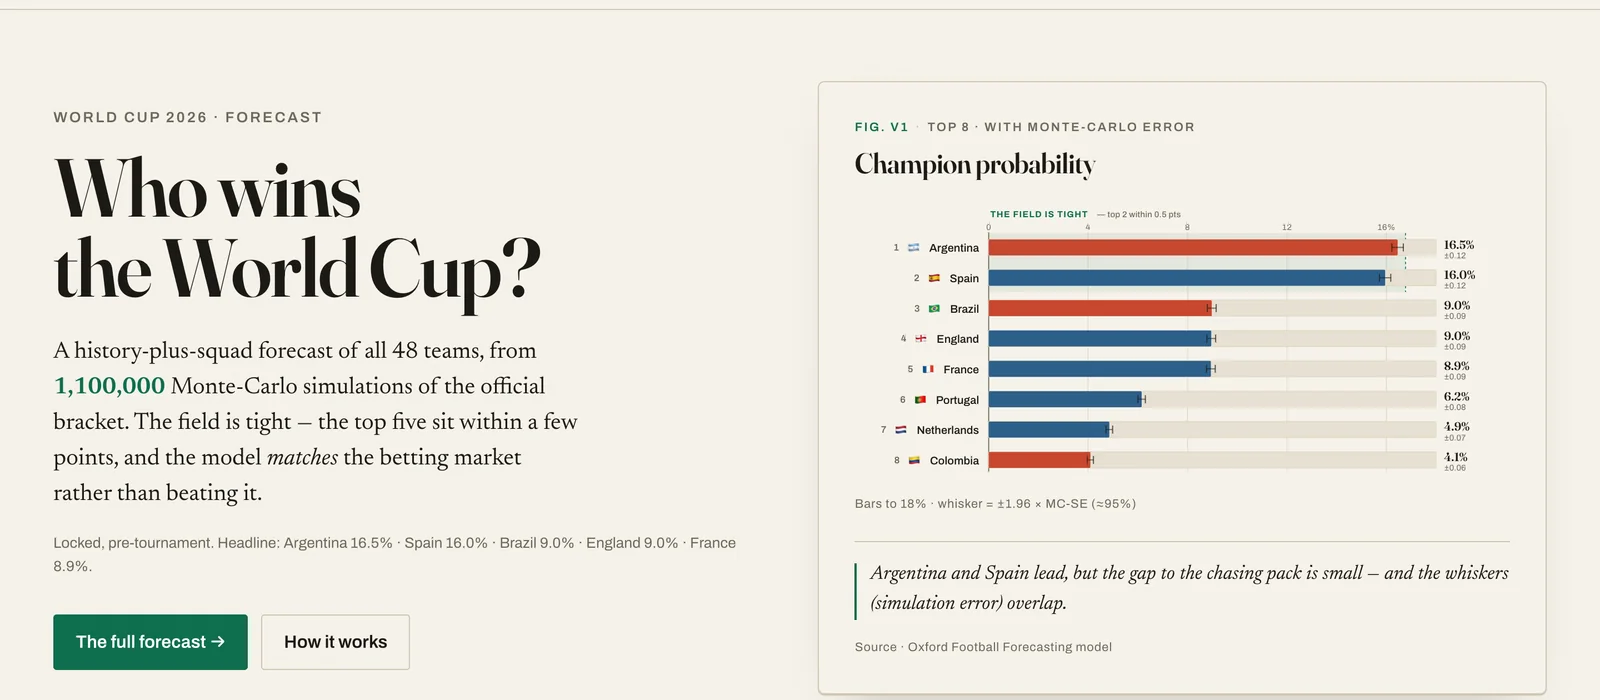
The World Cup forecast was locked before the first match and published with its SHA-256 fingerprint, so any later change to the file would show. It gives champion, group and match probabilities for all 48 teams from 1,100,000 Monte Carlo simulations of the official bracket, with FIFA's tiebreakers. Before the tournament Argentina led at 16.5 per cent, ahead of Spain at 16.0 per cent and Brazil, England and France at about 9 per cent each.
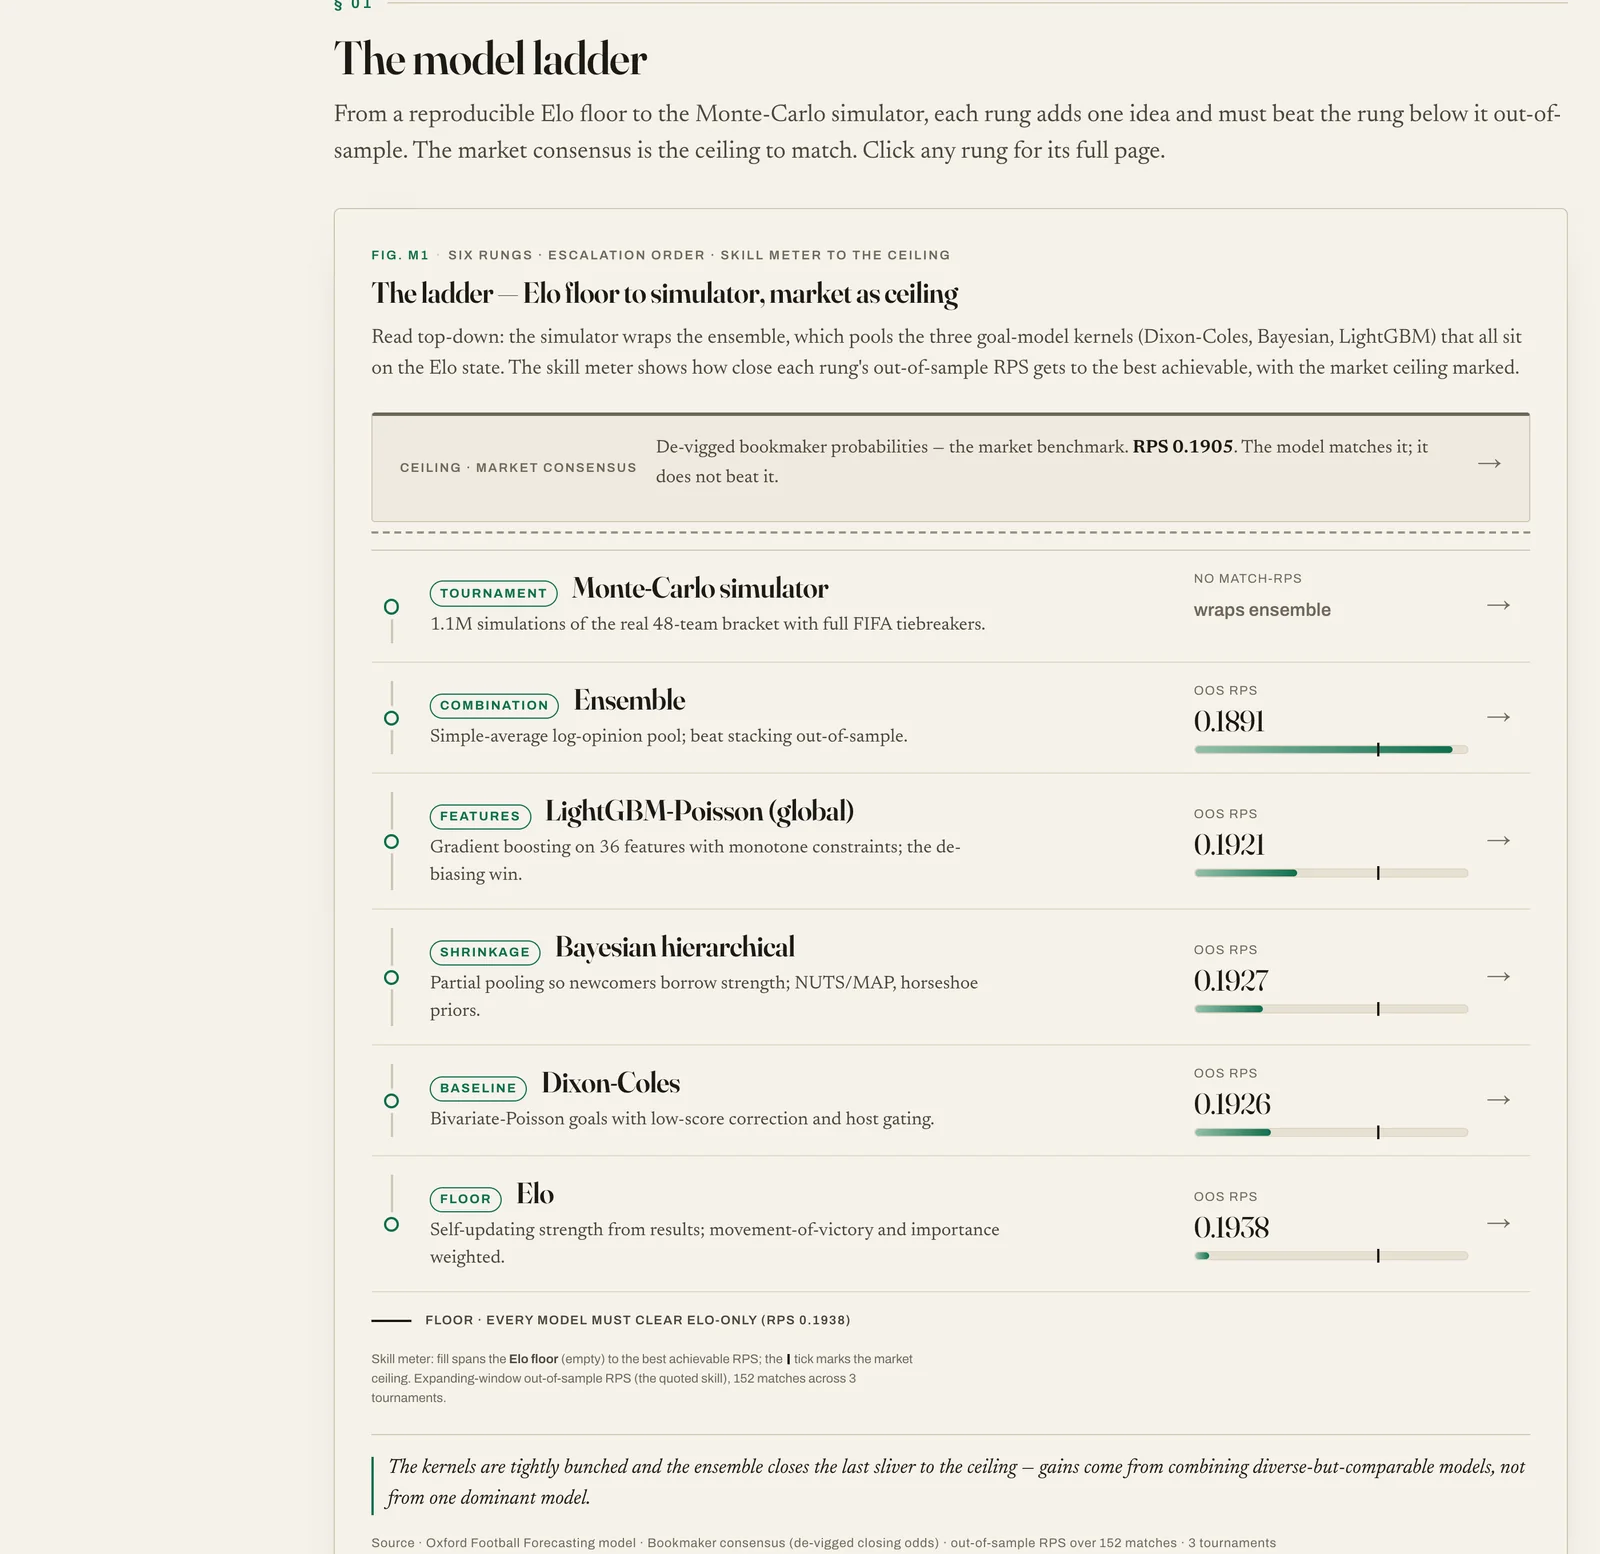
The forecast rests on six models, and each must beat the one below it on matches it has not seen. An Elo rating sets the floor. Dixon–Coles, a Bayesian hierarchical model and gradient boosting with LightGBM each turn team strength into a distribution of goals. An ensemble pools the three, and the simulator plays the bracket out. The data run to 49,445 international matches from 1872 to 2026, the 1,245 players of the 48 squads and club football in 68 countries.
The goal model
Dixon–Coles gives each team a goal rate built from a global scoring level, its own attack and the opponent's defence. A host bonus applies only to the United States, Canada and Mexico in their own stadiums.
Independent Poisson counts get low-scoring draws wrong, so a correction \(\tau\) reweights the four scorelines 0–0, 1–0, 0–1 and 1–1 and leaves the rest untouched.
The parameters maximise a log-likelihood in which each match is weighted by its age, with a small ridge that keeps the strengths of rarely seen teams finite.
Here \(\mu\) is the global mean log goal rate, \(\alpha_i\) and \(\beta_i\) are attack and defence centred on zero, \(h\) is the host advantage and \(\rho\) is the dependence of the correction, clipped to ±0.2. A match played \(t_m\) days before the fit is weighted by \(e^{-\xi t_m}\) with \(\xi = 0.0019\) per day, a half-life of about one year.
Matching the market
Each model is scored by the ranked probability score on 152 matches from three tournaments it had not seen, the Copa América and the European Championship of 2024 and the World Cup of 2022. The score compares the forecast with the result across the ordered outcomes of a match, and lower is better.
With \(r = 3\) ordered outcomes, \(p_j\) is the forecast probability of outcome \(j\) and \(o_j\) is 1 for the outcome that happened and 0 otherwise.
| Model | Out-of-sample RPS |
|---|---|
| Elo rating, the floor | 0.1938 |
| Bayesian hierarchical | 0.1927 |
| Dixon–Coles | 0.1926 |
| LightGBM | 0.1921 |
| Betting market, the ceiling | 0.1905 |
| Ensemble | 0.1891 |
The ensemble scores slightly better than the market, but with only three tournaments the confidence intervals overlap almost entirely. The study therefore claims parity with the market, not an edge. The blend test says more. The best mix of model and market gives the model a weight of 0.66, with an interval that excludes zero, so the model carries information that the market does not fully price.