Project ·
AI Use and Occupations: studying AI and work
A research paper, interactive website and 35 downloadable datasets for studying published AI activity across countries and occupations, with documented links to labour statistics.
I have been working with data from the Anthropic Economic Index and have created AI Use and Occupations to extend its use in research on AI and work across countries. The project combines a research paper, documented datasets and an interactive website.
The starting point is a practical question: when people bring different activities to an AI system, what can those requests tell us about the kinds of work associated with AI use? Answering it across countries requires attention to the activities recorded, the information published and the way occupations are classified.
Why I built it
Platform records bring actual AI activity into a discussion often organised around what models might be capable of doing. They offer a way to examine the activities people bring to an AI system and how the observed pattern differs across places.
Making those records useful for occupational research takes several additional steps. The source uses US occupational categories, while European and UK labour statistics often use different classifications. Publication coverage varies across countries. A missing category can reflect an unpublished observation, rather than the absence of activity. I built the project to document those choices, examine their consequences and give other researchers usable tables alongside the methods.
What the observations represent
Anthropic classifies conversations into activities and occupation categories and publishes aggregate summaries. I work with those public summaries; I do not collect or read private conversations.
Consider a request to debug a piece of code. It provides evidence of programming-related activity. The person making the request could be a software developer, a student or someone working on a personal project. The activity label does not identify the person’s occupation or establish that the request was made during paid work.
The main country comparisons use the consumer Claude.ai observations for April and May 2026 in the 26 June 2026 source release. Occupation observations are published for 121 countries and areas in May and 114 in April. The wider directory contains 250 geographic entries so that places without published observations remain visible. It is not a claim that all 250 have measured AI use.
The observation timeline also includes earlier weekly task snapshots. These differ from the later monthly occupation observations and should not be joined into an uninterrupted trend without accounting for changes in measurement.
Publication coverage changes the picture
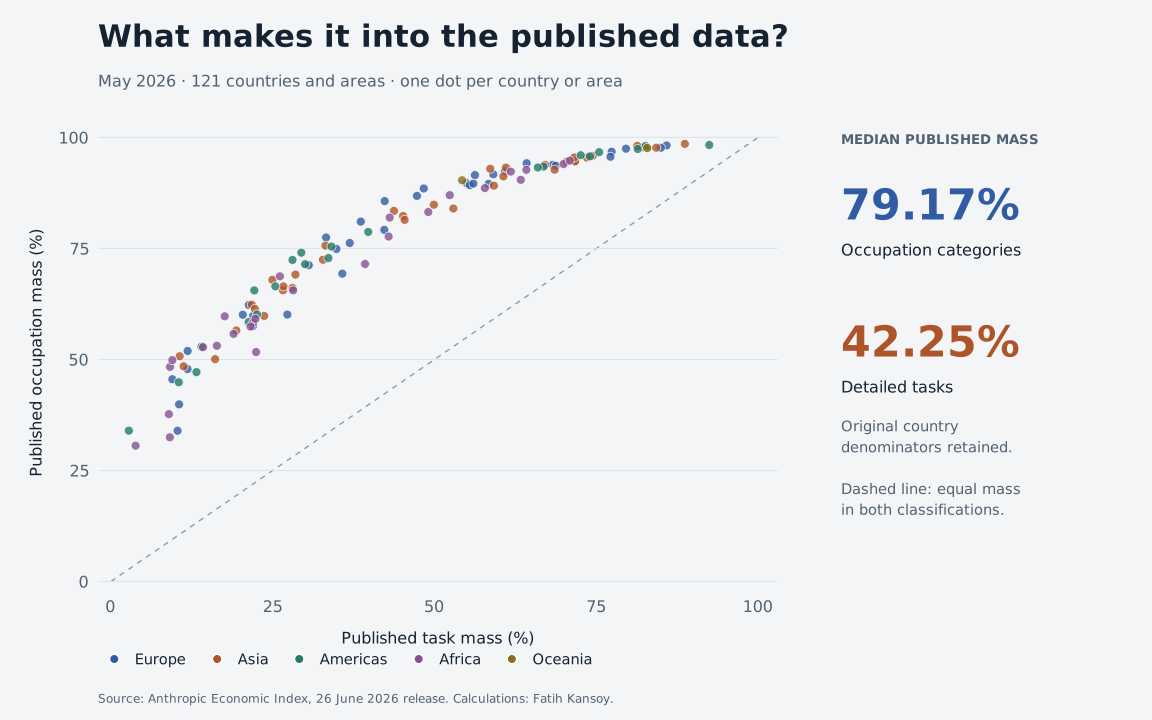
The figure above illustrates one of the project’s central findings. Across the May country observations, the median published occupation mass is 79.17%, compared with 42.25% for detailed tasks. Here, “published mass” means the sum of the released shares, using each country’s original consumer-use denominator.
This difference matters when choosing a measure. A count of published tasks describes the breadth visible in the release; it does not by itself measure how widely workers use AI. The project therefore makes direct occupation shares the primary descriptive evidence and keeps task measures, missing observations and publication coverage separately documented. The paper examines these distinctions and the relationship between publication support and country usage volume.
Connecting US and European job categories
A crosswalk is a table that links categories in one classification to categories in another. The project uses documented links from the US O*NET system to European ESCO occupations and international ISCO groups, with a separate route for UK SOC categories. The European Commission’s ESCO–O*NET crosswalk is an important source for this work.
These links are sometimes exact and sometimes broader or narrower. They describe similarities between job categories, not observed movements of workers or conversations. The crosswalk explorer lets readers inspect the alternatives and see how mapping choices change the occupational descriptions.
The occupation allocation divides each published source share across its linked destination occupations using fixed weights. Those weights sum to one, so the mapped shares and any unmatched activity add back to the original published total. The method keeps missing publication separate and does not rescale the visible activity to 100%. It also reports how much a destination’s share could vary when ambiguous links are allocated differently. These are ranges conditional on the source data and allowed links, not statistical confidence intervals.
This construction makes it possible to compare an occupation group’s allocated activity share with its share of employment. For example, German ICT professionals receive an allocated 10.96% of national consumer activity under the baseline mapping, compared with 2.71% of employment in 2025. The ratio of 4.04 describes how concentrated the recorded activity is relative to jobs; it does not say that 4.04 times as many ICT workers use AI. The methods explain the mapping assumptions, and the US employment comparison supplies a benchmark using native occupation codes.
What researchers can download and reuse
The data catalogue contains 35 downloadable datasets, with previews and field definitions. The files serve different purposes and do not all cover the same countries, occupations or periods:
- Country and occupation evidence: published usage values, observation periods and source statuses for comparing activity within a common classification.
- Coverage and availability: tables showing where observations exist, how much information is published and where gaps remain.
- Occupation allocations: shares in international ISCO and UK SOC categories, mapping weights, conditional ranges and accounting checks. Nonadditive donor averages remain separate diagnostics.
- Employment context and validation: selected labour statistics and comparisons with other measures, retaining the relevant source years, definitions and limitations.
- Prepared outcome panels: fixed usage measures joined to UK employment and nominal hourly pay for 2021–2025, UK recruitment adverts for January 2017–July 2026, and European employment from 2020 onward.
- Month comparisons: April–May changes under fixed mapping weights, preserving both months’ publication support and original denominators.
- A multilingual reference: official ESCO labels and available descriptions for 3,010 occupations across 28 languages, to help design local classification evaluations. It is a reference dataset, not a completed test of classifier accuracy.
Reusing the data means taking an appropriate table into another study. A researcher could compare the pattern of published occupational activity across countries, replace the allocation rule to test a finding’s sensitivity, or use a prepared outcome panel as the starting point for an employment or pay study. The documentation records each measure’s units, dates, populations and quality flags so those decisions can be examined.
The outcome panels do not contain an estimated AI effect or a successful prediction test. Historical annual outcomes precede the 2026 usage measure, and the only full advert month after the predictor’s release carries a source-quality notice. No clean forward-test month is available in this snapshot. Recruitment adverts also differ from successful hires. The validation page distinguishes the checks that succeed from unresolved measurement questions; the paper appendices explain how the files were constructed.
Explore the website
Start with the global publication figure. Hover over a dot to see the country and values, select a region to show only its countries and areas, and switch between the two observation months or figure views. The country selector and values table follow the region filter.
The country directory opens individual country evidence, while the comparison page places published occupation values side by side. The allocation explorer shows mapped shares, employment comparisons and conditional ranges. Filtered tables and figures can be downloaded, and view links preserve selections.
The research paper, Measuring AI Use across Countries and Occupations, presents the motivation, literature, methods and results. Its five appendices document construction, allocation formulas, additional comparisons, exposure reconstruction and research extensions. The publications page provides the HTML and PDF, bibliography, citation details and research code.
A foundation for further measurement
The wider contribution is a documented way to investigate what published platform activity can support. More informative publication records, independent checks of classifications across languages, and consistent observation windows would strengthen this type of research. Representative worker or firm surveys would help identify who uses AI at work. Longer outcome series and a credible research design would be needed to test economic effects.
I set out these priorities in the research agenda. The project gives researchers a starting point they can inspect, question and build on, while giving other readers a way to explore the evidence directly.
